Climate Literacy Principle 6C: Human activities have affected the land, oceans, and atmosphere, and these changes have altered global climate patterns. Burning fossil fuels, releasing chemicals into the atmosphere, reducing the amount of forest cover, and rapid expansion of farming, development, and industrial activities are releasing carbon dioxide into the atmosphere and changing the balance of the climate system.
| |
|
|
|
| Scientist map | | Consensus map |
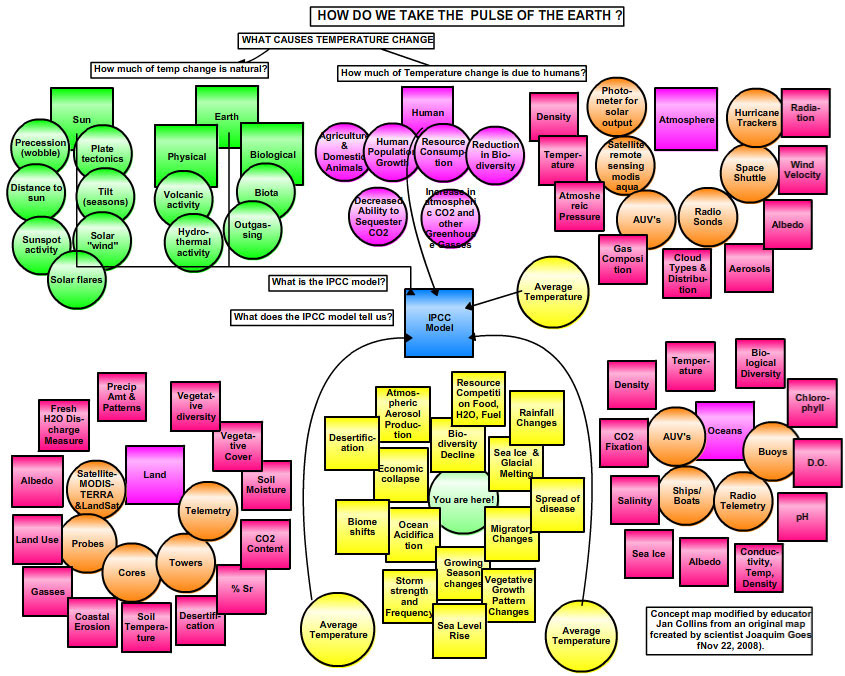
Do You Believe in Climate Change and Global Warming? Joaquim Goés (scientist) and educators Jan Collins, Susan Lamdin, and Ann Witzig
Save map to CMB: Scientist Map | Consensus Map
Download (pdf): Scientist Map | Consensus Map
Dr. Goés finds that people are really interested in discussing who or what is responsible for global warming - is this change part of a natural cycle or is it human-influenced - or both? On his map he wanted to highlight signs of climate change, denoted by the circle of concepts around Earth. He connected all these concepts back to humans as they have direct and often dire consequences on life. His team of educators was very interested in teaching their students that scientists are able to collect data that inform them about the process of climate change. It was a different approach than Dr. Goés took with his first map. Dr. Goés found it interesting that sensors and new technologies could be a hook for students to learn more about global warming.
| |
|
|
|
| Scientist map | | Consensus map |
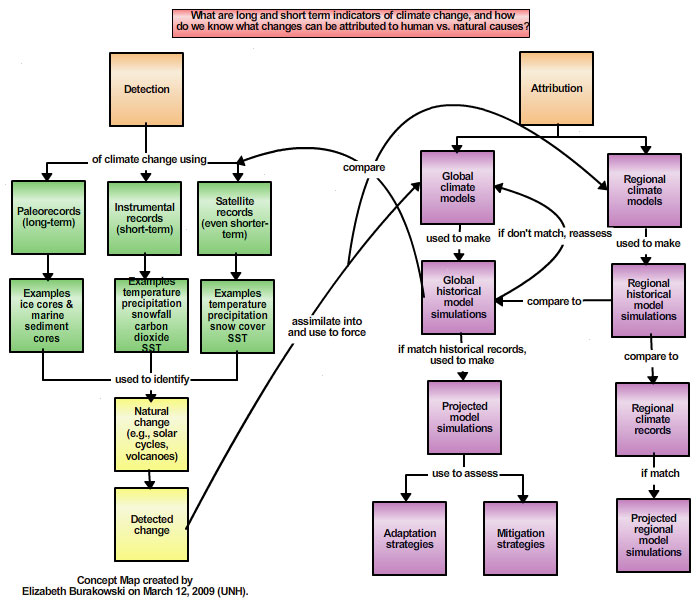
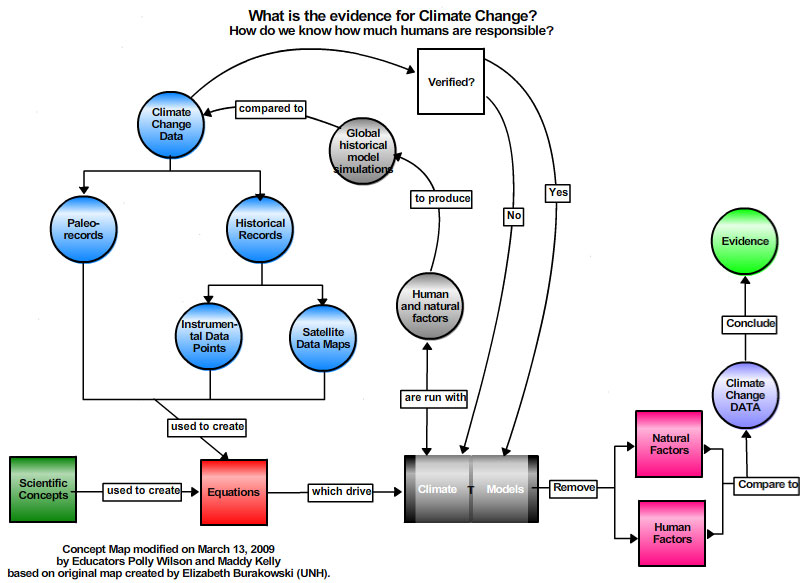
Elizabeth Burakowski (scientist) and educators Bryan Field, Maddy Kelly, and Polly Wilson
Save map to CMB: Scientist Map | Consensus Map
Download (pdf): Scientist Map | Consensus Map
Dr. Burakowski’s initial concept map focused on the long-term and short-term indicators of climate change, particularly how scientists distinguish between human versus natural causes. Working with educators, her team re-configured her initial map to follow a conceptual flow from scientific concepts to the equations that drive climate models. An important part of the map is how the evidence for climate change is produced by analyzing computer model outputs that separate natural factors from human factors.
| |
|
|
|
| Scientist map | | Consensus map |
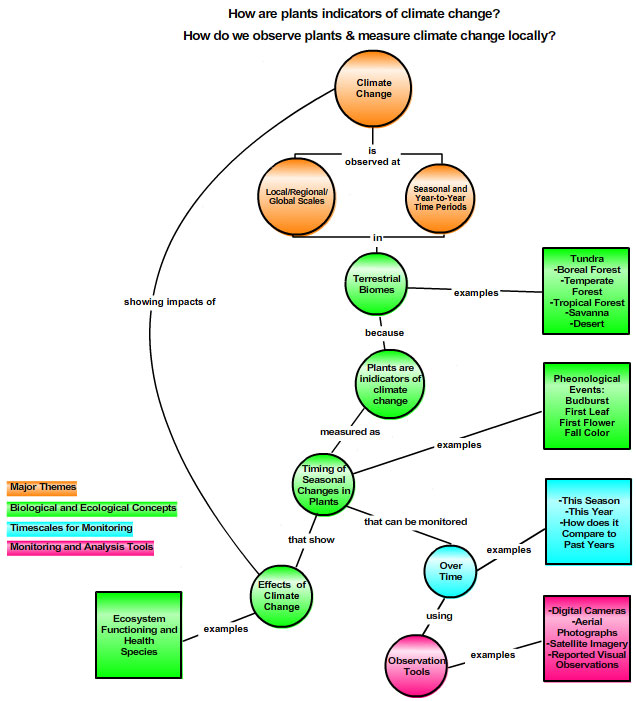
Annette Schloss (scientist) and educators Jayshree Oberoi and Betsy Stefany
Save map to CMB: Scientist Map | Consensus Map
Download (pdf): Scientist Map | Consensus Map
Dr . Schloss had not previously used the concept mapping technique. She began by creating a map that shows how changes in biomes can be measured locally and how such observations can be tied to regional climate change. Her hope is that a focus on local and regional examples of climate change will empower citizens to make changes where they live. Working with the educators, the group discussed various types of audiences that might want to learn about this topic, and decided to create a map targeted at the 8th grade level. On their consensus map, Climate Change is shown to be observed at the local, regional and global scale, and also on a temporal scale. They used color coding to distinguish major themes and came up with two new focus questions.