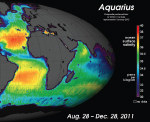
The Aquarius mission is brimming with educational content that hits all four areas of STEM: science, technology, engineering and mathematics. The design and engineering of the satellite, the science of ocean observing, the technical specifications for the mission and the importance of understanding global processes through data can all be illustrated using Aquarius as an example.
In this poster, NASA’s education and outreach team illustrates their multi-pronged approach to creating educational products and opportunities for educators to utilize information and data about Aquarius.
Scientific Process in Practice was a 2 hour long, weekly seminar designed to complement a field course for incoming oceanography majors (sophomores and juniors). Through hands-on activities, this seminar aimed to help students succeed in the field and later science courses.
Tested in University of Maine semester courses and summer workshops, this supplement to Oceanography magazine focuses on educational approaches to help engage students in learning and offers a collection of hands-on/minds-on activities for teaching physical concepts that are fundamental in oceanography.
This learning activity is part of an overall series entitled "The Potential Consequences of Climate Variability and Change". This series of three activities demonstrates some effects of rising levels of greenhouse gases on climate.
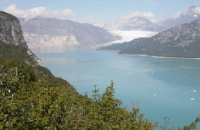
The first activity, "How Does the Make-up of the Atmosphere Affect Temperature?", asks students to construct a model to address the matter of increasing levels of greenhouse gases and their relationship to increasing atmospheric temperatures. The second activity, "How Do Higher Temperatures Affect the Water Cycle?", will demonstrate how an increase in temperature will speed up the water cycle, resulting in higher rainfall amounts followed by increased evaporation and subsequent drought. The final activity, "What Will Happen if Climate Variability and Change Cause Glacier and Polar Ice Cap Melting?", will show how the melting of ice can lead to a rise in sea level and subsequent flooding of coastal areas.
This lesson plan investigation allows students to see how geography and a spatial perspective are useful in addressing global challenges. Data gathering and organization skills are emphasized as students create maps of global aerosol hazards. In small groups, students collect either long-term or short-term data showing the distribution of global aerosols and convert the data into a map. Groups then compare their maps to identify patterns and sources of aerosols around the world.
Scientists use layers of rock with embedded fossils to glean information about the past. These layers of rock are called strata. This simple activity simulates how scientists study the past (using a paper recycling bin and worksheet) to make the connection with students that fossil layers were deposited in a known order (deepest records are oldest), and that the collection of accurate data is critical.
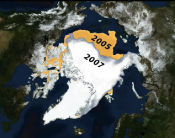
The history of the Earth has been characterized by global change of a very gradual nature. However, the Earth's history has also included events of abrupt change. Often these changes coincide with catastrophic events (meteorite impact 65 million years ago). At other times, the global climate system gradually moves closer to a breaking point, at which time abrupt change occurs. Scientific ocean drilling has provided stunning examples of these abrupt events through its recovery of deep sea sediment cores.
This website has activities and resources, including a picture of a real ocean core showing abrupt changes, to help students analyze the evidence for abrupt changes in Earth's climate system using ocean cores.
What are climate cycles? The Earth's climate is cyclical - that means that there is a regular pattern of change over time. Scientific ocean drilling has been the tool in reconstructing virtually every climate record from 500,000 years ago to nearly 70 million years ago. So, deep sea cores obviously hold a lot of clues in discovering what ancient climate was like.
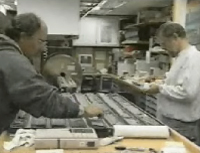
This video animation shows how oceanic rock and sediment cores are scientifically analyzed by a variety of techniques and archived in cold storage for future study. This animation covers how biological, chemical, physical and geochemical studies are conducted on each core collected, and what these data can tell scientists about the history of the Earth.
How old is It? It's always one of the first questions that everyone asks about deep ocean rock cores. How do we really know how old these cores of rock and sediment are? Scientists studying paleohistory (past history of the Earth) need to know the answer to this question because it is important to gain a time context for every core they collect. Without the age, it is very difficult to tell a story, geologic or otherwise.
This activity will guide you through one of the methods scientists use call biostratigraphy, the use of microfossils to obtain ages for cores. The activity requires access to the School of Rock website to access an essential datasheet.
This is an animation showing the feeding habits of Nanomia cara (a pelagic, or mid-water, colonial jellyfish also known as a siphonophore). Nanomia feeds on small oceanic crustaceans including the very numerous copepods shown as their prey in this animation. Jellyfish play a very important role in oceanic foodwebs.
This website has a poster that shows several different images of microfossils, taken through microscopes, as well as activities for students simulate the identification and use of these microfossils to examine past climate change and Earth history. Activities include: Small Creatures-Big Science, Secrets of the Sediments, Nannofossils Reveal Seafloor Spreading Truth.
What are red tides? Red tide is a phenomenon caused by algal blooms (Wikipedia definition) during which algae become so numerous that they discolor coastal waters (hence the name "red tide"). This tutorial with educator collections is an excellent introduction with links to further study.
Follow scientists in this excellent interactive website looking for life in the seemingly hostile hot springs of the Russian Far East. There are four units to explore: getting to Kamchatka by helicopter, following the scientists into the laboratory to collect data, find out why these studies help us understand the first signs of life on Earth, and find out how microbes leave their mark for millenia.
Though climate change isn't new, the study of how human activity affects the earth's climate is. The exploration of climate change encompasses many fields, including physics, chemistry, biology, geology, meteorology, oceanography, and even sociology. At this Web site, you can explore scientific data relating to the atmosphere, the oceans, the areas covered by ice and snow, and the living organisms in all these domains. You'll also get a sense of how scientists study natural phenomena-how researchers gather evidence, test theories, and come to conclusions.
Microbes account for more than 90% of ocean biomass and constitute a hidden majority of life that flourishes in the sea. This site contains a variety of educational and supporting materials for students and teachers of microbiology.
The Habitable Planet: A Systems Approach to Environmental Science is a course for high school teachers and undergraduate students in environmental science. The content course will help teachers of biology, chemistry, and Earth science provide more content in their classes. Course components include 13 half-hour video programs, a coordinated Web site which includes the streamed video programs, the course text online, five interactive simulations, background on the scientists who created the content and those whose research is documented, a professional development guide (also available in print form), and additional resources. Graduate credit is available for the course through Colorado State University.
This course begins with an overview of the Earth's systems - geophysical, atmospheric, oceanic, and ecosystems - as they exist independently of human influence. Following this introduction, the course explores the effect that human activities have on the different natural systems. Topics include human population growth and resource use, increasing competition for fresh water, and climate change. Each of the 13 programs features two case studies following top scientists in the field.
This online textbook chapter from Rediscovering Biology supports and extends the content of Unit 5: Emerging Infectious Diseases video, which can be accessed online at the URL listed. This is course designed initially for high school biology teachers. The chapter content covers the factors affecting the emergence of disease including a subchapter topics on Insect Vectors and Climate and Weather, with discussions on global climate change, Cholera and Hantavirus outbreaks.
Emerging and Re-emerging Infectious Diseases has two objectives: to introduce students to major concepts related to emerging and re-emerging infectious diseases and to convey to students the relationship between basic biomedical research and the improvement of personal and public health.
Most people understand that significant climate changes are predicted in the next century, but they may not be aware that these changes will likely vary regionally. Using climatological data from the University of New Hampshire's EOS-Webster, students will obtain annual predictions for minimum temperature, maximum temperature, precipitation, and solar radiation for Minnesota and California to explore this regional variability. They will learn how to access climate model predictions from EOS-Webster, a digital library of free Earth science data. They will then be walked through the process step-by-step of producing graphs of the data in a spreadsheet application to compare climate predictions among U.S. states through the year 2100. Students are asked to analyze the graphs to interpret regional trends in climate change. Data used: Climate Model Predictions. Tools used: EOS-Webster, and access to the a spreadsheet application like Microsoft Excel.
This website is a collection of Images and notes from a workshop presented to grade 5-12 science and math teachers, suggesting how SeaWiFS data can be incorporated into the curriculum. One of the modules is about ocean chemistry and discusses major ions in seawater, seawater composition, carbonate buffer system chemistry, dissolved organic and inorganic carbon and Redfield Ratios, nutrient loading in the ocean, and sources and sinks of carbon in marine environments.
This interactive learning demo includes two videos (ocean energy sources and global impacts) and supplementary resources. The ocean energy sources described and explained are tidal energy, ocean thermal energy conversion, and wave energy. Oil, natural gas, and methane hydrates are non-renewable but potent fossil fuels that lie buried in sea-floor sediments. There are two activities included with this learning resource: ocean thermal energy and methane hydrates.
As part of a high school course on astronomy, Newtonian mechanics, and spaceflight by Dr. David P. Stern, this webpage chapter explores the link between the tilt of the Earth's axis to the ecliptic and seasons of the year -- length of day, effectiveness of sunlight, polar day and night, and seasons south and north of the equator, as well as near it.
From this web page you can access graphic presentations of predicted and observed water levels, air and water temperatures, wind speed and direction, and air pressure in real time from U.S. coastal and territorial waters.
This material is based upon work supported by the National Science Foundation (NSF) under Grant # NSF OCE-0707385. Any opinions, findings, and conclusions or recommendations expressed in this material are those of the author(s) and do not necessarily reflect the views of the NSF.
COSEE-Ocean Systems Central Office School of Marine Sciences, University of Maine Darling Marine Center 193 Clark's Cove Road Walpole, ME 04573
Phone: (207) 563-8176 E-mail: cosee-os