Ocean Literacy Principle 5D: Ocean biology provides many unique examples of life cycles, adaptations and important relationships among organisms (symbiosis, predator-prey dynamics and energy transfer) that do not occur on land.
| |
|
|
|
| Scientist map | | Consensus map |
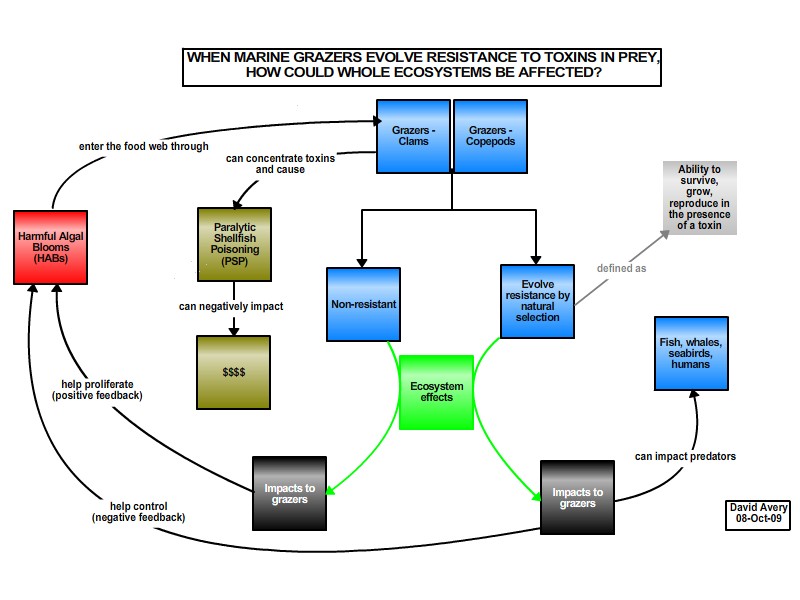
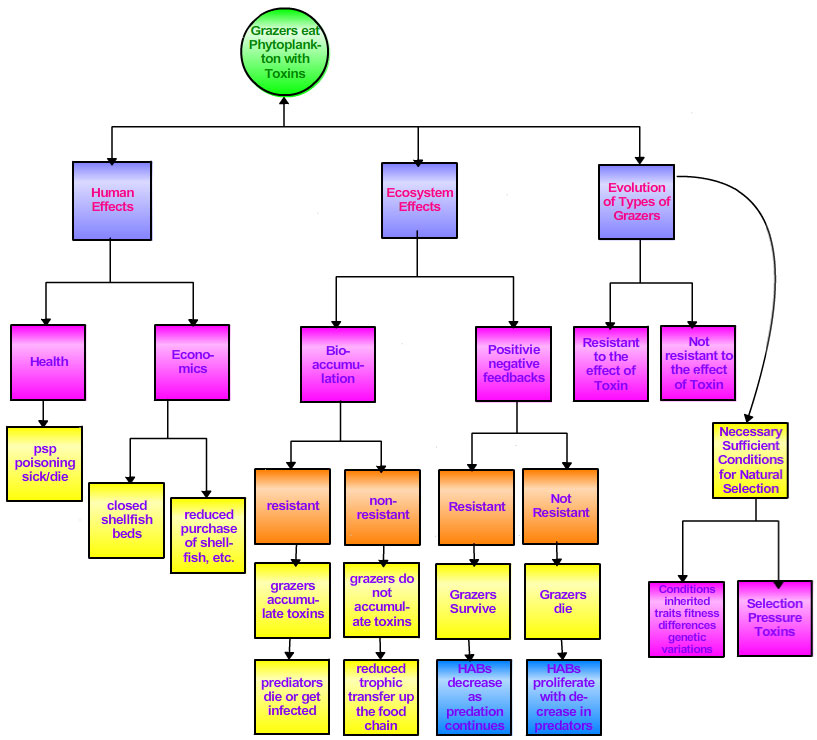
When Marine Grazers Evolve Resistance to Toxins in Prey, How Could Whole Ecosystems be Affected? David Avery (scientist) and educators Kristen Andrews, James Backus, and Kim Martino
Save map to CMB: Scientist Map | Consensus Map
Download (pdf): Scientist Map | Consensus Map
Dr. Avery started by making a concept map that describes the effects of toxic phytoplankton blooms (also known as Harmful Algal Blooms or HABs) on grazing animals - such as copepods. HABs are responsible for local shellfish closures in the Long Island Sound, which has far-reaching impacts both on the environment and local fishery industries. In his original concept map, Dr. Avery showed the cycle of feedback loops that may occur. The team of educators suggested an alternative arrangement for his concept map, showing the different paths that could be taken. The linear approach was something that helped clarify his point, and the educators helped him see why feedback loops could be a confusing concept for audiences.
| |
|
|
|
| Scientist map | | Consensus map |
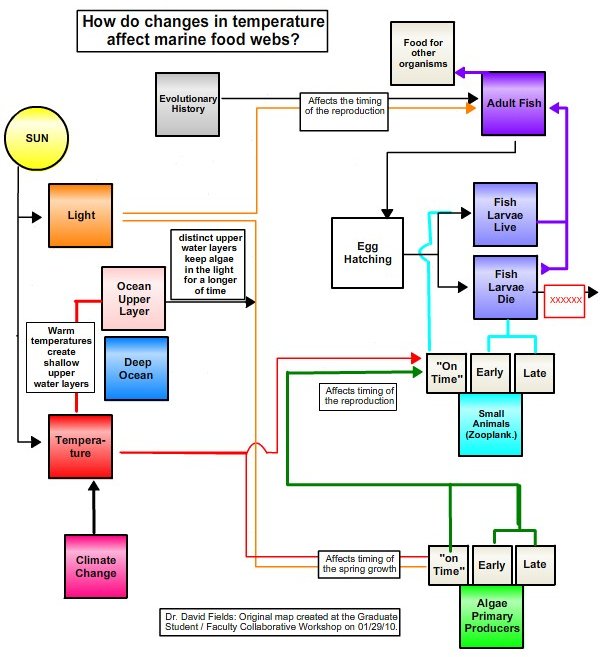
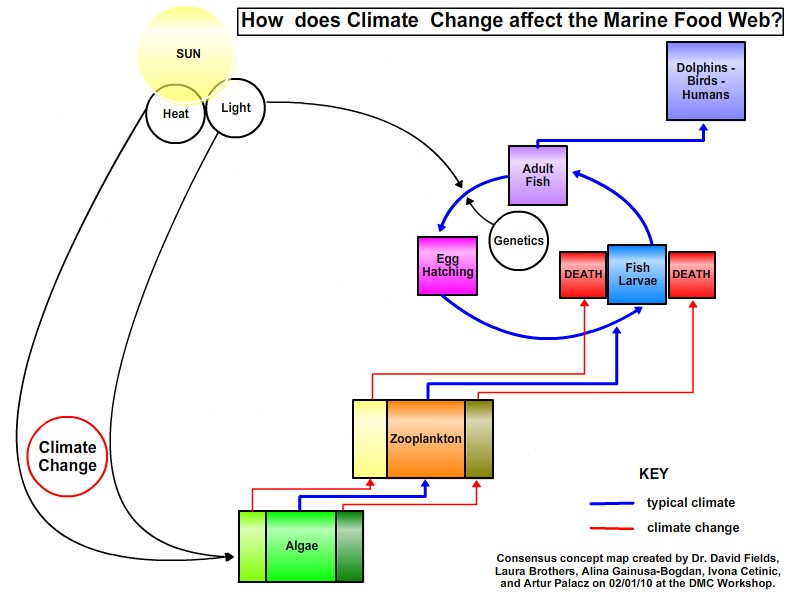
David Fields (scientist), students Laura Brothers, Alina Gainusa-Bogdan, and Artur Palacz, and post-doc Ivona Cetinic
Save map to CMB: Scientist Map | Consensus Map
Download (pdf): Scientist Map | Consensus Map
Initially Dr. Fields struggled to find a way to clearly display the timing of multiple linked events on his concept map. He started with the sun as a major concept. Both sunlight and temperature directly influence the life cycles and growth rates of phytoplankton at the base of the food chain. His team streamlined the consensus map so that the story of food chain connections and population growth over time was more accessible to their target audience - freshman in college with no marine science background. They restated their focus question and removed all time-related concepts from each trophic level and replaced them with easy-to-follow lines. Blue lines connect maximal population abundance and maximum trophic transfer: "good timing" during typical climate conditions. Red lines connect populations that are out of synch due to climate change.
|