Ocean Literacy Principle 7D: New technologies, sensors and tools are expanding our ability to explore the ocean. Ocean scientists are relying more and more on satellites, drifters, buoys, subsea observatories and unmanned submersibles.
| |
|
|
|
| Scientist map | | Consensus map |
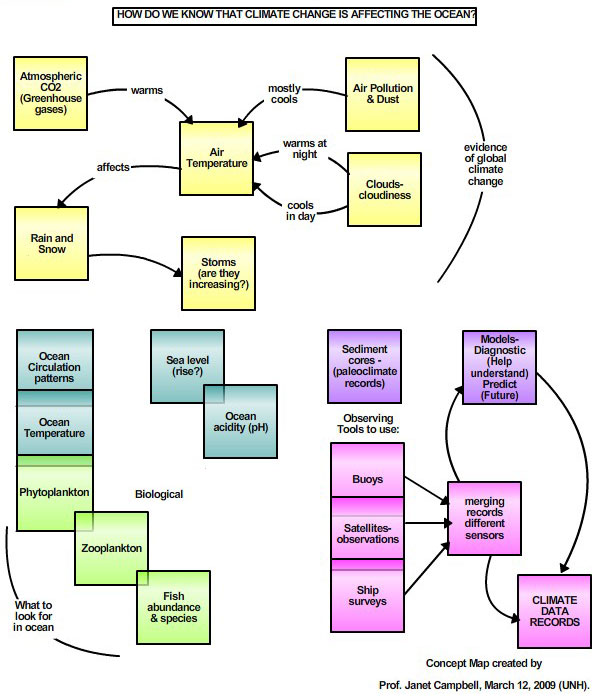
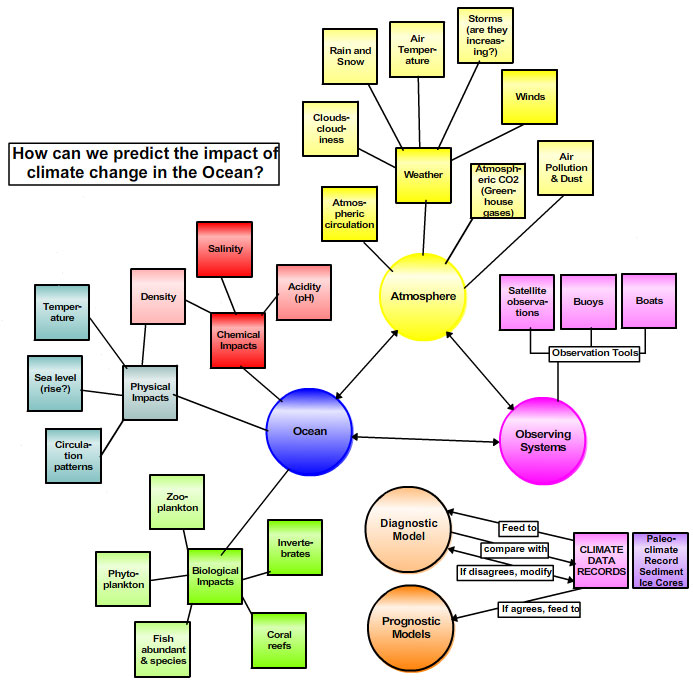
How Can We Predict the Impact of Climate Change in the Ocean? Janet Campbell (scientist) and educators Jill Denniston and Julianne Mueller-Northcott
Save map to CMB: Scientist Map | Consensus Map
Download (pdf): Scientist Map | Consensus Map
Dr. Campbell says, “even though water covers over 70% of the globe, most people don't think about how climate change might impact the ocean”. She thinks the vast remote nature of the ocean makes it difficult to observe climate change impacts, and feels that the development of reliable diagnostic computer models is key to understanding how and why the ocean has changed in the past. Her team of educators rephrased the focus question. They reorganized the map by both adding more detail, and showing the basic components of this topic. They regrouped the concepts and added many more interconnections.
| |
|
|
|
| Scientist map | | Consensus map |
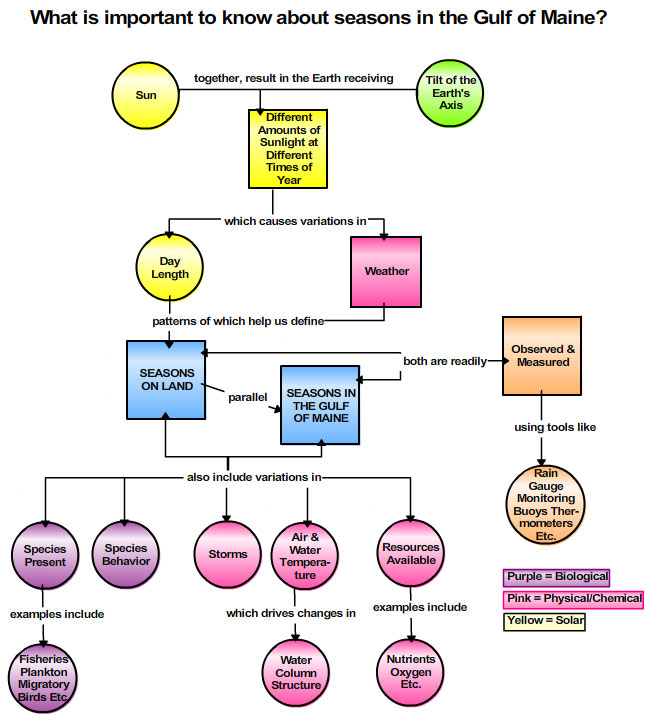
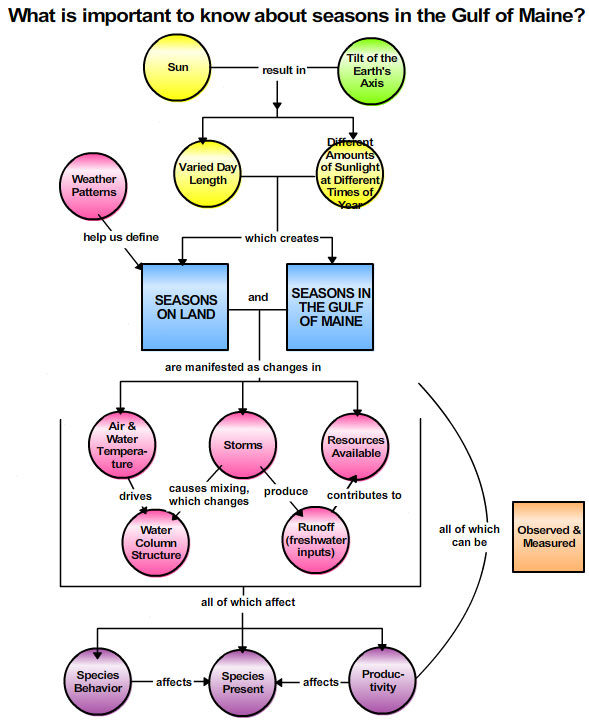
Deb Goodwin (scientist) and educators Edmund Chun-Taite, Carla Companion, and Sylvia Scharf
Save map to CMB: Scientist Map | Consensus Map
Download (pdf): Scientist Map | Consensus Map
The initial map Dr. Goodwin prepared for the educators started with the underlying reason we have seasons. Working with the educators, they decided to physically rearrange many of the concepts on her original map. They spent a lot of time on linking phrases which helped them to understand the scientific basis of the map, and communicate with each other in a clear concise way. They found a neat trick for expanding the information associated with the concepts: they added descriptions so that when a user rolls over the concepts, the explanation pops up. Dr. Goodwin was happy to discover the map could be used by the informal educators for topics ranging from tidepool seasonality to the water cycle. They will use the map as a starting point for working with various audiences in the future.
| |
|
|
|
| Scientist map | | Consensus map |
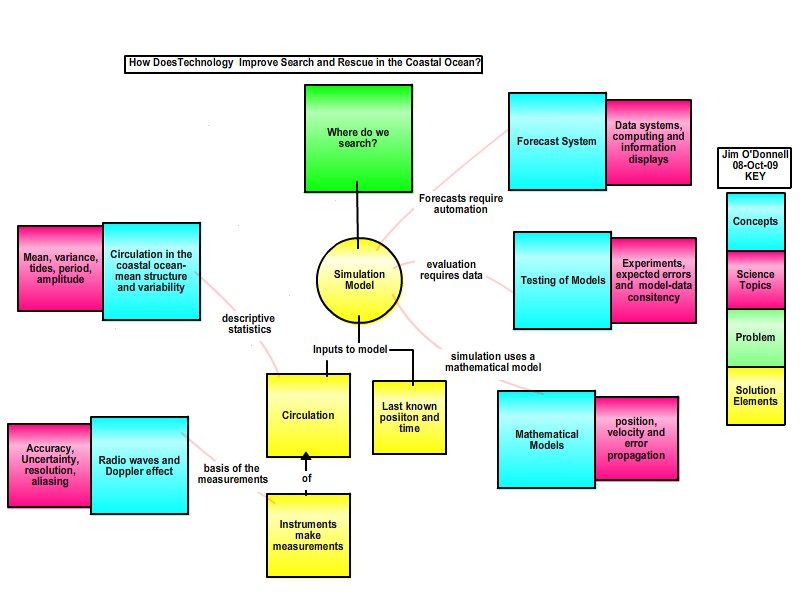
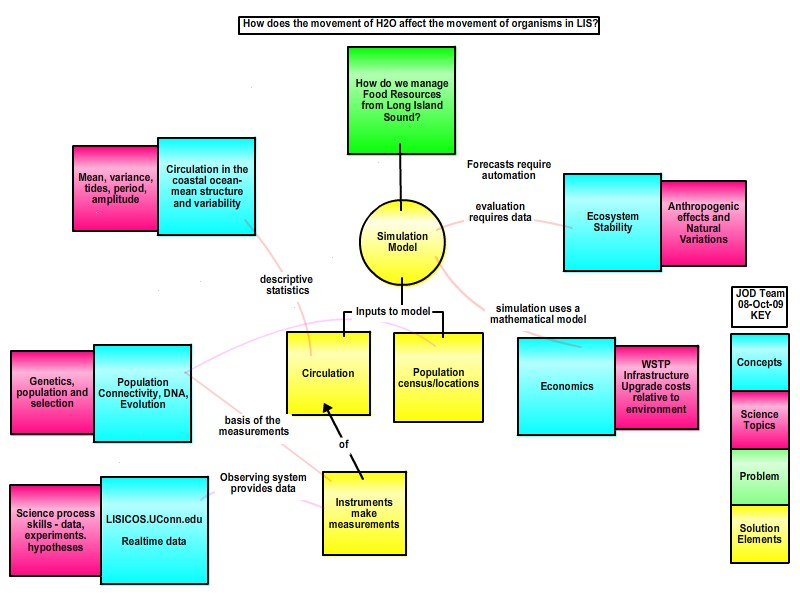
James O'Donnell (scientist) and educators Valerie Cournoyer, Linda Livolsi, and Mary Lou Smith
Save map to CMB: Scientist Map | Consensus Map
Download (pdf): Scientist Map | Consensus Map
When Dr. O’Donnell first tried to create a concept map, he realized that this field is relevant to so many things that it might be better to give a specific example. So he chose a topic that he hoped people could engage with: circulation data that are used for search and rescue purposes. He constructed the map with the problem in the middle: "Where do we search?" In collaboration with the educators, they decided to keep the same basic structure as his search and rescue concept map but changed the focus question to "How does the movement of water affect the movement of organisms in Long Island Sound?" He found the conversations with the educators - and the shift in topic to better meet their needs - quite informative and enlightening.