Ocean Literacy Principle 7E: Use of mathematical models is now an essential part of ocean sciences. Models help us understand the complexity of the ocean and of its interaction with Earth’s climate. They process observations and help describe the interactions among systems.
| |
|
|
|
| Scientist map | | Consensus map |
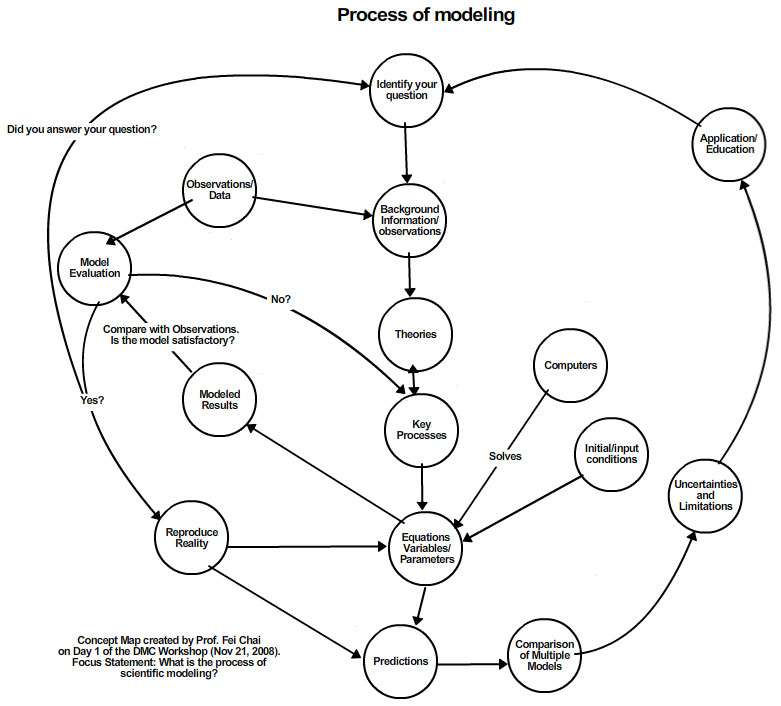
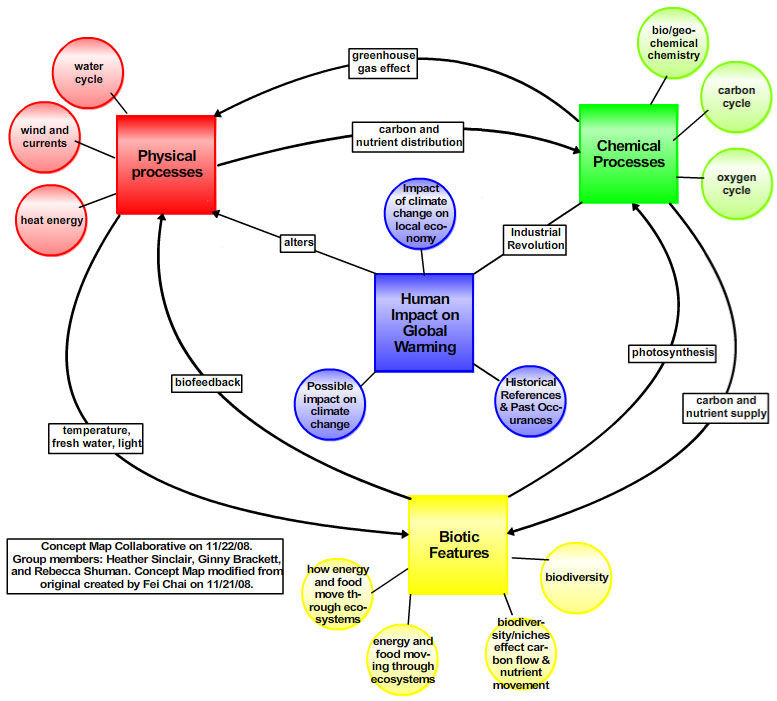
Modeling the Ocean-Climate System Fei Chai (scientist) and educators Virginia Brackett, Heather Sinclair, and Rebecca Shuman
Save map to CMB: Scientist Map | Consensus Map
Download (pdf): Scientist Map | Consensus Map
Dr. Chai addressed 3 questions with his map. 1) How are the climate change/ocean climate models created; and how do scientists use them to predict climate behaviors? 2) Where do data come from? 3) What processes or variables do scientists decide to include in those models? His map depicted how to model the ocean-climate system. The consensus map depicted what the ocean-climate system model was modeling. It diagrams the human impact on natural systems and processes in the global environment.
| |
|
|
|
| Scientist map | | Consensus map |
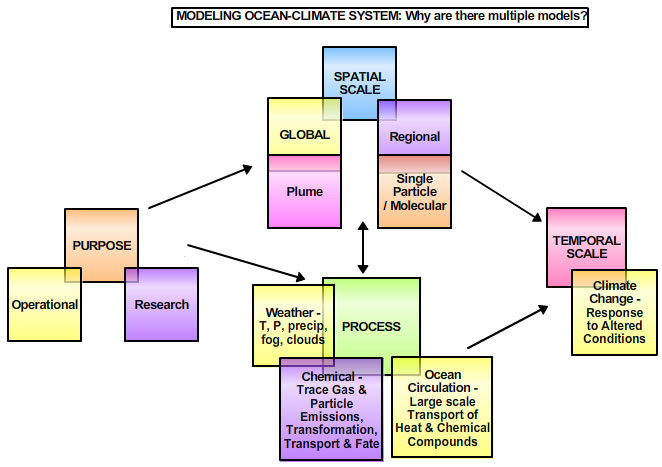
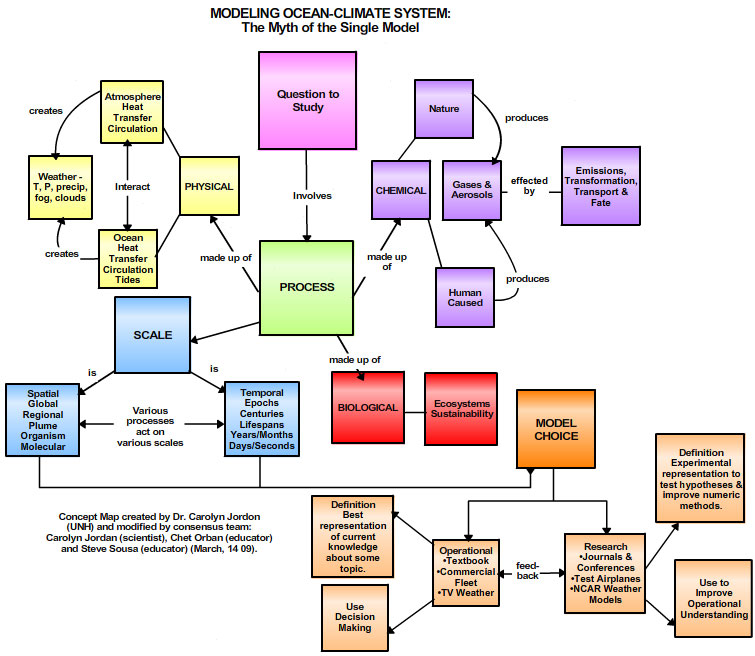
Carolyn Jordan (scientist) and educators Chet Orban and Steve Sousa
Save map to CMB: Scientist Map | Consensus Map
Download (pdf): Scientist Map | Consensus Map
Dr. Jordan explains models are mechanisms used to understand chemistry, physics, and biology through mathematical representations of the real world. She thinks temporal scales are extremely important, especially when it comes to climate change models. Dr. Jordan says, “We need to look at various models at many different scales to collectively understand what our future climate may be like”. Her team of educators altered the focus question and reorganized her map, adding more detail to include how model data can be used.
| |
|
|
|
| Scientist map | | Consensus map |
Michael Whitney (scientist) and educators Carrie Birdsong, Louise McMinn, and Karen Romano Young
Save map to CMB: Scientist Map | Consensus Map
Download (pdf): Scientist Map | Consensus Map
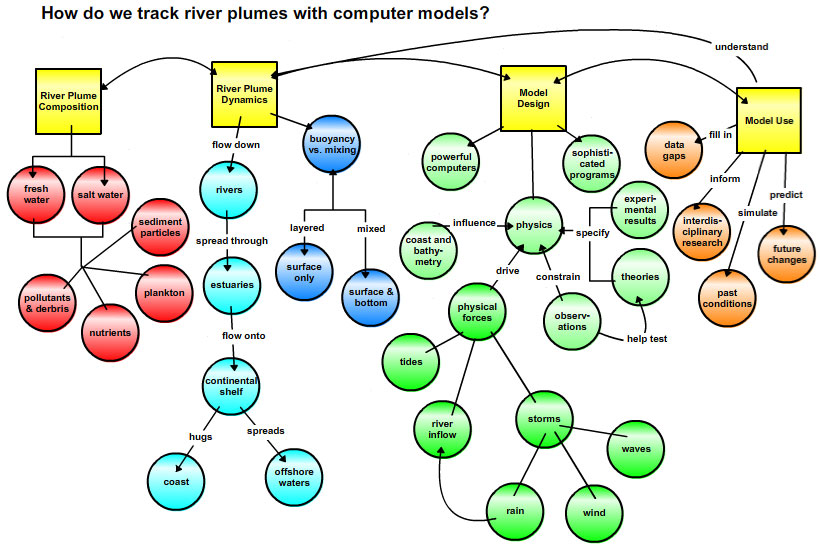
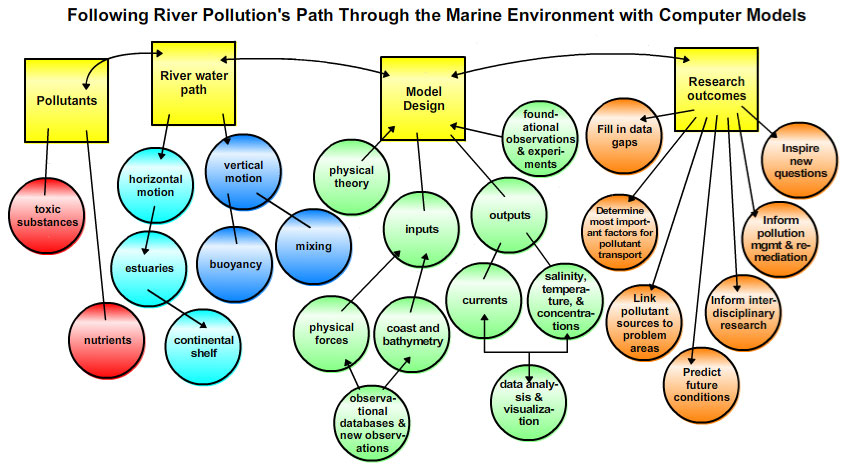
Dr. Whitney is a physical oceanographer and spends a lot of time modeling coastal waters. The concept map he presented to the educators focused on how river plumes are tracked with computer models. Since it's not possible to get data from everywhere in a river plume, models can fill in the gaps of missing data. The map that he and the educators collaborated on followed the same basic format that he had presented. However, they decided to reduce the number of concepts and focus on the example of pollutant transport to give students a clearer picture of how river plumes can affect their daily lives. To illustrate, Dr. Whitney shared an example of how the Delaware Bay river plume was modeled to help answer questions about water quality issues downstream of this river plume.
| |
|
|
|
| Scientist map | | Consensus map |
Andrew Pershing (scientist), students Marissa McMahan and Ashley Young, and post-doc Maria Nielsdottir
Save map to CMB: Scientist Map | Consensus Map
Download (pdf): Scientist Map | Consensus Map
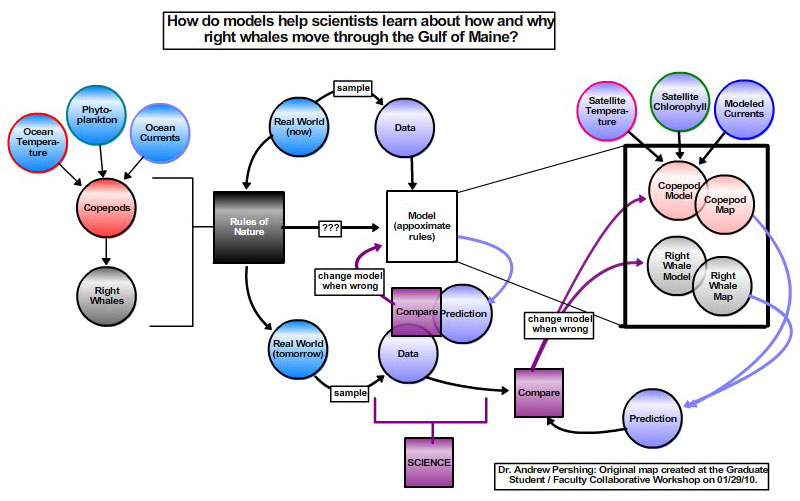
Dr. Pershing’s two goals were to show how these predictions are made and to explain what models are and how they are used. When he presented his concept map to the graduate students he went into a fair amount of detail about the specifics of the model's development, the main data sets used to populate the model, and the outputs of the models. In collaborating with the graduate student/post doc team, it was decided not to talk as much about models in general but rather to focus more on how the right whale model works. The graphic format of the map also changed in that they developed three different sections. In presenting to the high school students the team chose to add a drawing of a whale and a computer monitor as a means of engaging them. They also opened the presentation with a video of right whales feeding at sea and prompted the high school students to develop their own understanding about right whales prior to the presentation.