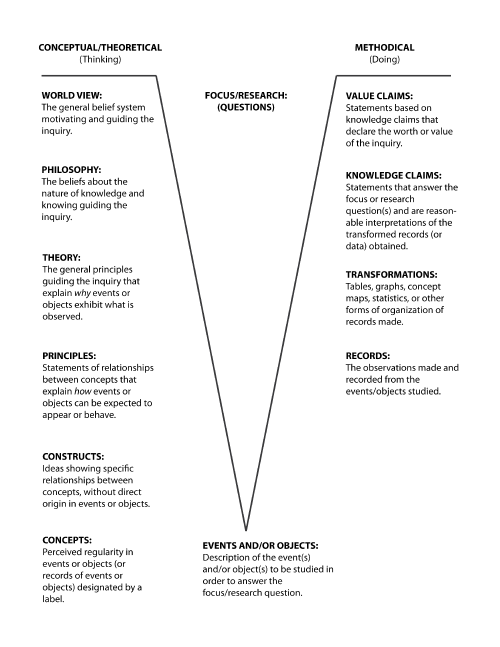
The V Diagram is named for its "V" shape. It provides a structure for an experiment or study, ensuring a strong theoretical and conceptual basis and solid analysis. It is a thorough way of representing knowledge about a subject. It has a central focus question at the top, with theoretical and conceptual information along the left side, a concrete experiment, study, or experience at the point of the V, and analysis and evaluation of the experiment in light of the focus question along the right side. It is also called Gowin's vee, knowledge vee, and vee heuristic.
Below is an example of a V Diagram:
Create your own V Diagram:
Use this pdf form to create your own V Diagram. If do not know what type of information to type in each section, hover over the section with your mouse, and a "tooltip" will appear. You can type directly into the fields, and the file can be saved on your computer. You can also print the file, or email the file so that it can be reviewed by a colleague. Depending on your internet browser, this pdf may open directly in the browser or download to your desktop when clicked.
This material is based upon work supported by the National Science Foundation (NSF) under Grant # NSF OCE-0707385. Any opinions, findings, and conclusions or recommendations expressed in this material are those of the author(s) and do not necessarily reflect the views of the NSF.
COSEE-Ocean Systems Central Office School of Marine Sciences, University of Maine Darling Marine Center 193 Clark's Cove Road Walpole, ME 04573
Phone: (207) 563-8176 E-mail: cosee-os