Education and Outreach Resources
Salinity Processes in the Upper Ocean Regional Study (SPURS) is a large-scale, ocean-based scientific study lead by NASA that is
actively addressing the essential role of ocean salinity in the global water cycle through an investigation at the salinity
maximum region in the middle of the Northern Atlantic Ocean.
|
||||
Slideshow of composite SSS data taken by the NASA Aquarius instrument. Hover over images to see month. |
- River of Salt [JUMP]
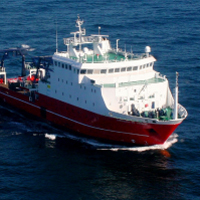
- Sarmiento de Gamboa SPURS Cruise Blog [JUMP]
- SPURS Webinar Series [JUMP]
- SPURS Blog [JUMP]
- Sampling Strategy Challenge: Interactive Lesson Plan [JUMP]
- NASA Aquarius Instrument: Education Pages [JUMP]
- Salinity: Basic Resources [JUMP]
- Water Cycle Basics and Intensification [JUMP]
- Ocean Deserts: Regions of Salinity Maximum [JUMP]
- Ocean Salinity: Links to Global Climate Through Ocean Circulation [JUMP]
- PO.DAAC SPURS Mission Page [PO.DAAC]
- PO.DAAC SPURS Archived Data [PO.DAAC]
 |
 |
 |
 |
 |
 |
 |
 |
 |
Sampling Strategy Challenge: Interactive Lesson Plan |
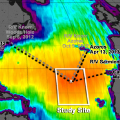 |
This is a step-by-step interactive lesson plan that can help your students understand the process behind planning a cruise of this magnitude as they become familiar with the challenges scientists face in conducting research on the open ocean. Both teacher and student instructions are available.
 |
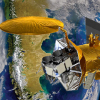 |
On these pages, among the many resources available, you will find: student learning outcomes, salinity basics, classroom activities, and data-driven tools, along with webinars featuring Aquarius scientists.
 |
Salinity: Basic Resources |
Salt of the Earth: Salinity, Temperature & Density [flash video with teaching resources]
Salt is really a molecule in ocean water, but collectively, it plays a role in ocean circulation
The Power of Sea Salt [video] A ScienceCast movie from Science at Nasa
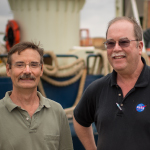
Ocean Salinity Viewed from Sea and Space [SPURS blog] NASA Program Scientist Eric Lindstrom describes why scientists want to spend six weeks at sea measuring ocean saltiness
Salinity Basics [website] How much salt is there? Where does the salt come from? Is salinity uniform throughout the ocean? Answers to these questions and more
Interactive Salinity Questions [interactive website] Questions and answers about sea surface salinity from the Aquarius Education Technology Team
Ocean Circulation and Climate [website] Ocean salinity's influence on the environment can be summarized by looking at Earth's three major latitude zones: high latitudes, mid-latitudes, and the tropics
Salinity Data and Tools [suite of interactive tools] Find the data set that most closely corresponds to sea surface salinity patterns
Aquarius Student Outcomes [website] Twenty three student outcomes addressed by Aquarius EPO materials and aligned with National Science Education Standards
Aquarius Classroom Activities [website] "Hands on" laboratory activities for Grades K-12
 |
Water Cycle Basics and Intensification |
Water Cycle Overview [NASA animation]
This animation depicts a cross-sectional view of a coastal area
Precipitation, Evaporation and Condensation [NASA animation] Water falling from summer storm clouds onto a field of wheat today will someday fall again somewhere else - this is the essence of the water cycle
Aquarius Water Cycle [NASA animation] How does water move? Through the water cycle, the process by which water circulates from the ocean, to the atmosphere, to the land, and then back to the ocean
Water, Water Everywhere: Water Cycle & Climate Change [flash video with teaching resources] The water cycle affects and is affected by climate variations
An Oceanographer and the Water Cycle [SPURS blog] If one wants to find out what the water cycle is doing, one should be looking at the oceans
What Does Sea Surface Salinity Tell Us About the Global Water Cycle? [suite of scientist-created concept maps] Concept map created by Dr. Felix Landerer at the June 2011 NASA/JPL Workshop in Pasadena, CA
Ocean Salinities Reveal Strong Global Water Cycle Intensification During 1950 to 2000 [scientific article] Long-term changes to the ocean salinity field provide an insight into water cycle change expressed by E-P changes
Ocean Salinity Trends Show Human Fingerprint [news article] Like ocean temperature, variations in the last half-century are only explicable in the context of human-caused climate change
Big Changes in Ocean Salinity Intensifying Water Cycle [scientific article] Rapidly changing ocean salinities as a result of a warming atmosphere have intensified the global water cycle by an incredible 4 percent between 1950 and 2000
Dry Lands Getting Drier, Wet Getting Wetter: Earth's Water Cycle Intensifying With Atmospheric Warming [scientific article] A clear change in salinity has been detected in the world's oceans, signalling shifts and an acceleration in the global rainfall and evaporation cycle
Earth's Water Cycle Is Intensifying, Dry Is Getting Drier and Wet Is Getting Wetter [scientific article] The Earth's water cycle is intensifying, leading to more evaporation in dry climates and more rain in wet climates
Interactive Data Tools for Changes in Salinity Over Time [interactive tools] Annual cycle mlaps and time-series plots for salinity, temperature, and density
The Water Cycle Activity [lesson plans/activities] This activity focuses on two aspects of the water cycle: evaporation and condensation
 |
Ocean Deserts: Regions of Salinity Maximum |
Geographic Variation in Salinity [flash video with teaching resources]
Dr. Susan Lozier, Duke University, describes an 'ocean desert'
Ocean Salinity Viewed from Sea and Space [SPURS blog] NASA Program Scientist Eric Lindstrom describes why scientists want to spend six weeks at sea measuring ocean saltiness
Interactive Data Tools for Finding Salinity Spatial Patterns [interactive tools] Annual cycle maps and time series plots for salinity, temperature, and density
 |
Ocean Salinity: Links to Global Climate Through Ocean Circulation |
An Oceanographer and the Water Cycle [SPURS blog]
If one wants to find out what the water cycle is doing, one should be looking at the oceans
Climate Change and the Global Ocean: Monitoring Climate Change Impacts By Satellite [flash video with teaching resources] Soon a new satellite will even help us see tiny particles on the ocean's surface - like salt, which drives huge conveyor belts of water through the world's oceans
Salt of the Earth: Ocean Atmosphere Circulation Helps Moderate Climate [flash video with teaching resources] Things that happen now will still be manifest hundreds of years in the future
Ocean Circulation [website] A compilation of videos, activities, tools, and articles relating to ocean circulation
How Understanding Salinity Helps Us Understand Climate Change [concept map with archived webinar] Part III of this COSEE-OS webinar focuses on the formation and melting of sea ice and how this affects ocean circulation
How Does Salinity Drive Ocean Circulation? [concept map] Concept map created by Dr. Tony Lee at the June 2011 NASA/JPL Workshop in Pasadena, CA
Density: Sea Water Mixing & Sinking [lesson plan/activity] Temperature and salinity help govern the density of seawater, which is a major factor controlling the ocean's vertical movements and layered circulation
Liquid Rainbow [lesson plan/activity] When solutions of two different densities meet, the lower density solution will move on top of the higher density solution, resulting in a layering or stratification of the solutions

