Eighty six percent of global evaporation and seventy eight percent of global precipitation occur over the oceans. Sea surface salinity is a key variable in understanding how fresh water input and output affect ocean dynamics and provide a better understanding of ocean-atmosphere interactions linking the water cycle, ocean circulation and climate variability. The Aquarius instrument is measuring this much-needed variable.
Want to make salinity and its connections to the water cycle, ocean circulation and climate come alive for your students? NASA Aquarius Education and Public Outreach has teamed up with COSEE-OS to conduct three public and four educator-focused webinars, as well as a pre-launch workshop at NASA Jet Propulsion Laboratory.
The 2008 North Atlantic Bloom Experiment (NAB08) was a collaborative effort to observe an entire phytoplankton spring bloom. To broadly disseminate results and contribute to the public’s understanding of ocean science, NAB08 participants collaborated with COSEE-OS to present a series of five webinars describing the motivations and findings of this multidisciplinary experiment.
The Aquarius mission is brimming with educational content that hits all four areas of STEM: science, technology, engineering and mathematics. This poster, presented at the 2012 Ocean Sciences Meeting, summarizes available educational products and opportunities.
After a successful launch in June of 2011, the Aquarius/SAC-D satellite has begun collecting global salinity data - but it is not without challenges. Learn from NASA scientists what it took to design, develop, and test the Aquarius satellite and how this leads to the collection of accurate global data in this COSEE-OS hosted webinar series.
This NMEA Special Report on the Ocean Literacy Campaign featuring the Ocean Literacy Scope and Sequence highlights the work of dozens of agencies and hundreds of individuals to bring ocean sciences into the mainstream of both formal and informal education.
Edward Maibach, M.P.H., Ph.D. and Director of the Center for Climate Change Communication (4C) lists five guiding principles in educating the public about the state of our oceans.
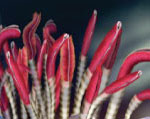
Hydrothermal vents are one of the most spectacular features on the seafloor. They form in places where there is volcanic activity, such as along the Mid-Ocean Ridge. Water seeps through cracks in the seafloor and is heated by molten rock deep below the ocean crust to as high as 400°C. The hot fluid rises to the surface and gushes out of the vent openings. This hydrothermal fluid carries with it dissolved metals and other chemicals from deep beneath the ocean floor. Ecosystems have been found thriving at these vents, relying on chemosynthesis rather than photosynthesis.
Discover a powerful visual tool to help your students and audiences– no matter where they live - improve their understanding of ocean and climate interactions. COSEE-OS has developed a suite of interactive multimedia tools that illustrate clear connections among and within the ocean, earth, and solar systems.
The Centers for Ocean Sciences Education Excellence (COSEE) is a national network with the collective mission to engage scientists and educators and transform ocean science education. The network is comprised of twelve centers that are either regional or thematci in focus. As a thematic center, COSEE Ocean Sytems has worked to create and develop a suite of interactive tools that can be used to enhance ocean and climate literacy by emphasizing the connections between the ocean and the Earth's climate system.
In two linked applications - The Ocean Climate Interactive (OCI) and the Concept Map Builder (CMB) - concept mapping is used as a foundation for learners to make connections between fundamental concepts in ocean and climate science. These cost-free online tools have been incrementally developed, tested, and refined through a series of teacher/scientist professional development workshops to maximize their efficacy.
Tested in University of Maine semester courses and summer workshops, this supplement to Oceanography magazine focuses on educational approaches to help engage students in learning and offers a collection of hands-on/minds-on activities for teaching physical concepts that are fundamental in oceanography.
This report gives an overview of the progress to to promote ocean literacy in classrooms. It highlights previous ocean literacy projects and shows how they have merged to provide a community vision for ocean literacy.
This resource explores Australia's Great Barrier Reef, the largest structure on Earth built by living organisms. It demonstrates the types of relationships among living things that have contributed to this incredible biodiversity and elaborates on some of the adaptations that have enabled species to survive and reproduce in this unique habitat.
This interactive flash animation allows students to compare the sizes of the smallest organisms we know of on our planet. Starting with the head of a pin at 2 millimeters in diameter, students can use this animation to compare the relative sizes of cells and organisms small enough to sit on a pinhead. Nearly invisible without magnification, dust mites dwarf pollen grains and human cells. In turn, bacteria and viruses are even smaller.
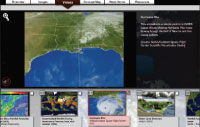
The North Atlantic Oscillation (NAO) may pale against El Nino's press, but this climate pattern can kick up a commotion all over the Northern Hemisphere. Lately, scientists have been discovering why. This four-part story describes the NAO, how it "does its thing," how data are "hunted and gathered," and NAO forecasting efforts.
The North Atlantic Oscillation (NAO) is a seesaw in atmospheric pressure between the subtropical high-pressure system over the Azores Islands and the subpolar low-pressure system over Iceland. Using this interactive flash, users can click on any of the highlighted years featured in the NAO index timeline to learn how the NOA may have affected history.
This lesson explores the relationship between density and ocean currents. Deep ocean currents are caused by differences in water temperature and salinity (density). In this experiment, the students will hypothesize the cause of ocean currents and then develop a model to help explain the role that temperature plays in deep ocean currents.
The North Atlantic Oscillation (NAO) is a seesaw in atmospheric pressure between the subtropical high-pressure system over the Azores Islands and the subpolar low-pressure system over Iceland. Users can learn more about the POSITIVE and NEGATIVE phases of the NAO and how it affects the climate of the North Atlantic region by clicking on the LOW and HIGH icons.
Dr. Martin Visbeck's online slide show about the North Atlantic Oscillation (NAO) is intended for older high school or undergraduate audiences. It gives background on the NAO, its impacts (temperature, precipitation, storminess, economics), its effects on the North Atlantic Ocean, the stratosphere, and global warming.
This learning activity is part of an overall series entitled "The Potential Consequences of Climate Variability and Change". This series of three activities demonstrates some effects of rising levels of greenhouse gases on climate.
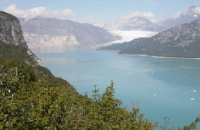
The first activity, "How Does the Make-up of the Atmosphere Affect Temperature?", asks students to construct a model to address the matter of increasing levels of greenhouse gases and their relationship to increasing atmospheric temperatures. The second activity, "How Do Higher Temperatures Affect the Water Cycle?", will demonstrate how an increase in temperature will speed up the water cycle, resulting in higher rainfall amounts followed by increased evaporation and subsequent drought. The final activity, "What Will Happen if Climate Variability and Change Cause Glacier and Polar Ice Cap Melting?", will show how the melting of ice can lead to a rise in sea level and subsequent flooding of coastal areas.
The Currents Tutorial is an overview of the types of currents, what causes them, how they are measured, and how they affect people's lives. It is made up of of 6 primary "chapters" or pages that can be read in sequence by clicking on the arrows at the top or bottom of each chapter page.
What are climate cycles? The Earth's climate is cyclical - that means that there is a regular pattern of change over time. Scientific ocean drilling has been the tool in reconstructing virtually every climate record from 500,000 years ago to nearly 70 million years ago. So, deep sea cores obviously hold a lot of clues in discovering what ancient climate was like.
This website has a poster that shows several different images of microfossils, taken through microscopes, as well as activities for students simulate the identification and use of these microfossils to examine past climate change and Earth history. Activities include: Small Creatures-Big Science, Secrets of the Sediments, Nannofossils Reveal Seafloor Spreading Truth.
Though climate change isn't new, the study of how human activity affects the earth's climate is. The exploration of climate change encompasses many fields, including physics, chemistry, biology, geology, meteorology, oceanography, and even sociology. At this Web site, you can explore scientific data relating to the atmosphere, the oceans, the areas covered by ice and snow, and the living organisms in all these domains. You'll also get a sense of how scientists study natural phenomena-how researchers gather evidence, test theories, and come to conclusions.
This material is based upon work supported by the National Science Foundation (NSF) under Grant # NSF OCE-0707385. Any opinions, findings, and conclusions or recommendations expressed in this material are those of the author(s) and do not necessarily reflect the views of the NSF.
COSEE-Ocean Systems Central Office School of Marine Sciences, University of Maine Darling Marine Center 193 Clark's Cove Road Walpole, ME 04573
Phone: (207) 563-8176 E-mail: cosee-os