|
Why was the SPURS Study Site Chosen?
)
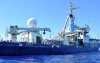
Click on the image for a closer view! Focusing on such a place will lead to understanding how the processes happening here apply more generally to these same processes happening around the global ocean. - Raymond Schmitt, SPURS Chief Scientist Featured Video: The North Atlantic's Ocean Desert
Ocean Salinity Viewed from Sea and Space [NASA Earth Observatory] NASA Program Scientist Eric Lindstrom describes why scientists want to spend six weeks at sea measuring ocean saltiness
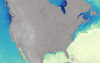
Aquarius Interactive Tools [NASA Aquarius] Spatial patterns of long-term mean data, annual cycle of monthly mean data, and change over time of yearly mean data Salinity Data and Tools [NASA Aquarius]
Find the data set that most closely corresponds to sea surface salinity patterns
Geographic Variation in Salinity [NASA Aquarius] Dr. Susan Lozier, Duke University, describes an ocean desert |

| |
This material is based upon work supported by NASA under NASA Jet Propulsion Laboratory Subcontract No. 1459277. Any opinions,
findings, and conclusions or recommendations expressed in this material are those of the author(s) and do not necessarily
reflect the views of NASA. SPURS Education & Outreach Office School of Marine Sciences, University of Maine Darling Marine Center | 193 Clark's Cove Road | Walpole, Maine 04573 Phone: (207) 563-8176 | Email |