|
Ocean Thinking: Balanced Budget? Oh, Buoy!
Determining ocean salinity trends is not a simple task. With differences in the amount of water, heat, and salt
constantly coming and going, as well as gradients across depth and latitude, it's a challenging task to undertake.
Dr. Farrar shares what data from a fixed mooring within the SPURS area can tell us about the overall "salt budget"
for one of the saltiest parts of the world's ocean. His story includes describing the nerve-wracking process of
deployment and recovery of the mooring, as well as how data from the buoy can work in conjunction with satellite
data to produce a more complete picture of the ocean's "salt budget".Webinar Archive
You can watch a video of the webinar below. Below the video is the concept map that Dr. Farrar presented, so that you
can follow along with the presentation.
Concept Map: What Has the SPURS Central Buoy Been Measuring and Why?
Dr. Farrar's concept map illustrates the diversity of measurements that can be gathered from one "platform" and how
those measurements can inform the greater salt budget. The different instruments measuring heat, freshwater and
current movement are showcased.You can explore the concept map in the window below or save it to your own CLIMB account by clicking on the light blue wrench in the upper left corner and selecting Copy Map to My Maps. To view this map as a PDF, click here (PDF, 108 KB).
This concept map forms the basis of Dr. Farrar's presentation. Hover over the concepts to uncover additional resources,
or save this map to your own CLIMB account by clicking on the
light blue wrench in the upper left corner and selecting "Copy Map to My Maps".
Applicable Next Generation Science Standards
Dr. Tom Farrar is an Associate Scientist at Woods Hole Oceanographic Institution. His research interests include air-sea interaction and exchange; dynamics and thermodynamics of the upper ocean; tropical dynamics and equatorial waves; oceanic internal waves and eddies; satellite oceanography; and ocean observing and instrumentation. These interests are pursued from an observational perspective using in situ observations, satellite observations, and, in some cases, laboratory and numerical models to test hypotheses and test or formulate simplified physical models that aid understanding.
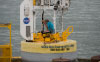
Mooring Deployment [NASA Earth Observatory] From the first SPURS cruise blog, Dr. Eric Lindstrom describes the deployment of the central mooring in September of 2012 The WHOI Buoy [NASA Earth Observatory]
An introduction to the WHOI Mooring and plans for its recovery on the latest SPURS cruise blog WHOI Mooring Recovery [NASA Earth Observatory]
This post details the recovery of the WHOI Mooring featured in this webinar
Data From the SPURS Central Mooring [Upper Ocean Processes Group] A website that allows you to browse the data collected by the SPURS Central mooring during the SPURS cruise SPURS Central Mooring [Upper Ocean Processes Group]
A diagram of the entire mooring and all of its instruments |


| |
This material is based upon work supported by NASA under NASA Jet Propulsion Laboratory Subcontract No. 1459277. Any opinions,
findings, and conclusions or recommendations expressed in this material are those of the author(s) and do not necessarily
reflect the views of NASA. SPURS Education & Outreach Office School of Marine Sciences, University of Maine Darling Marine Center | 193 Clark's Cove Road | Walpole, Maine 04573 Phone: (207) 563-8176 | Email |