|
|
| SEARCH | DATA SETS | ||||||||||||||||||||||||||||||||||
|
Data Sets Using research data provided by the scientists, workshop educators and University of Maine marine science graduate students developed datasets appropriate for inquiry-based lessons. The datasets are provided here in Excel format. Graduate students may be contacted for help in understanding the data and implementing lessons.
Scientist: Damian Brady Graduate Student: Beth Campbell This dataset highlights the effects of runoff on dissolved oxygen and chlorophyll, as well
as the influx of nutrients from wastewater treatment. Arsenic & Genetic Expression [ZIP, 40 KB] Scientist: Rebecca Van Beneden Graduate Student: Erin Macro These spreadsheets contain coded data from a study looking at gene expression in male
and female mice in response to exposure to arsenic. The changes in gene expression are displayed as deviations from
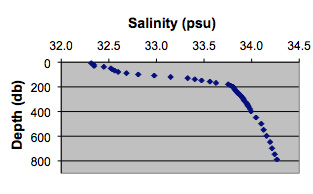
normal expression. Specific genes are highlighted to illustrate the differences. Salinity and Temperature [ZIP, 72 KB] Scientist: William Ellis Graduate Student: Carrie Armbrecht This dataset originates from buoy data from the Gulf of Maine Ocean Observing System
(GoMOOS) and highlights the difference between a bay, channel and open ocean site. The changes in salinity and temperature
over time are plotted along with some starter inquiry questions. Seasonal Copeopod Changes [ZIP, 3.5 MB] Scientist: Jeffrey Runge Graduate Student: Phoebe Jekielek This series of datasets explores the development and life cycle of Calanus copepods, a type
of zooplankton. It includes data on the abundance of copepods and amount of nutrients that are available. Cold Water Corals [ZIP, 9.2 MB] Scientist: Rhian Waller Graduate Student: Ashley Young The data in this set represent abundances of different fauna on various surfaces as
interpreted from a towed camera. Example graphs of abundance from different sites are included. Additional Datasets Topic: Sea Surface Salinity (Website) Summary presentation: Don't Forget the Salt! [PPT, 12.5 MB] Topic: Optical Data from Apex Float 0015 (Website) Zip File [2.5 MB] includes data, map showing float trajectory, and example charts |
|
|||||||||||||||||


