Curriculum Development Workshop
Workshop Theme: Using Real Data in the Classroom |
|
Held at Colby College in Waterville, ME
Monday, July 18 through Thursday, July 21, 2011 |
|
|
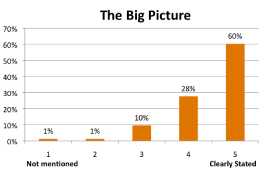
Scientists' concept map presentations were evaluated by the other scientists and by the educators participating in the workshop. Participants
were asked to rate each presentation according to four criteria:
- The Big Picture -- how well was the scientist's specific research question expanded to address broader issues and concerns and how clearly was that stated?
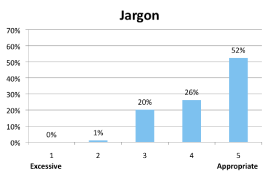
- Jargon -- how well did the scientists tailor their language to be accessible to a general audience or explain any jargon used?
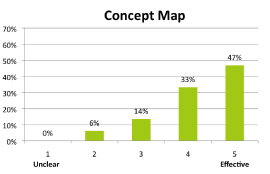
- Concept map -- how well did the map itself organize the information being presented and help the audience understand important ideas?
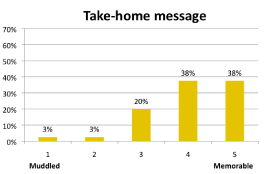
- Take home message -- how memorable was the overall message of the presentation?
Individual results, along with specific comments from participants, were sent to the five participating scientists after the workshop to provide
professional development for future presentations. The data below are an aggregate of all five scientist presentations.
Quotes from Workshop Participants
"I liked how the map(s) "developed" before us - it was easy to follow it bit by bit rather than looking at it all at once."
"Really liked the tabs (colors) to seperate the different parts of the map. Doesn't overwhelm a student - You "chunk" the information to make
it manageable."
|