|
|
| SEARCH | SCIENTIST-EDUCATOR COLLABORATIVE WORKSHOPS | |||||||||||||||||||||||||||||||||||||||||||||||||||||||||||||||||||||||||||||||||||||||||||||||||||||||||||||||||||||||||||||||||||||||||||||||||||||||||||||||||||||||||||||||||||||||||||||||||||||||||||||||||||||||||||||||||||||||||||||||||||||||||||||||||||||||||||||||||||||||||||||||||||||||||||||||||||||||||||||||||||||||||||||||||||||||||||||||||||||||||||||||||||||||||||
|
Topic: Climate Change
(Click images to view and save maps)
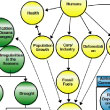
Climate Change and Global Warming
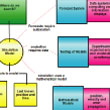
Scientist Joaquim Goés' original map highlights signs of climate change, including drought, forest fires, ocean
acidification, extreme rainfall events, icecap and glacial melting, and sea level rise. These are connected back to
humans, as they can have direct and often dire consequences on life. Emphasis was placed on ongoing learning about climate
change and the potential ways can mitigate its effect on earth's ecosystems. The educators who worked with Joaquim were
particularly interested in teaching their students that scientists are able to collect data that inform them about the
process of climate change and so included the types of sensors and instruments we use to measure climate change on
their consensus map ... [more]
Joaquim Goés | DMC Workshop
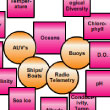
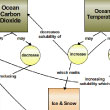
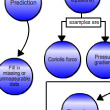
Predicting the Impact of Climate Change
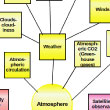
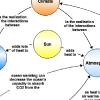
Those of us who live on land tend to notice atmospheric changes such as precipitation, storm activity, cloudiness, air
pollution, etc. The ocean also interacts with the atmosphere and thus is changing with climate as well; noticeable changes
include ocean currents, temperature, and shifts in marine biological patterns. Drastic changes in climate can lead to
dramatic consequences, incluing sea level rise and ocean acidification. The development of reliable computer models
is key to predicting how the ocean might respond to future climate change scenarios. This pair of maps looks at how the
ocean exhibits change, how this is measured, and how we can predict future impacts ... [more]
Janet Campbell | UNH Workshop
Plants as Indicators of Climate Change
Scientist Annette Schloss' concept map shows how changes in biomes (broad categories of vegetation that depend on similar
climatic conditions) can be measured locally and how such observations can be tied to regional climate change. Her team's
consensus map presents the same information but is geared toward a younger (8th grade) audience, using colors to distinguish
major themes, biological and ecological concepts, timescales for monitoring, and monitoring and analysis tools and listing
examples of terrestrial biomes and timing of seasonal change in plants ... [more]
Annette Schloss | SSC Workshop
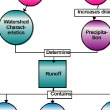
How Do Watersheds Influence Climate Change?
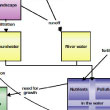
Watershed characteristics are mainly determined by land use (e.g., by humans) and the area. Climate change can impact not only
watershed characteristics but also the frequency and intensity of major storms. Scientist Ru Morrison examines the effect of
runoff on water clarity, ocean acidification, and the production of algal blooms. The consensus map focuses on climate change
impacts important to New England shellfisheries, such as short, intense storms that produce runoff containing high levels of
fecal bacterial and excessive nutrients. These nutrients can lead to Harmful Algal Blooms that contain toxins that
concentrate in shellfish ... [more]
Ru Morrison | SSC Workshop
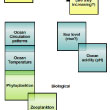
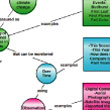
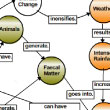
How Does Climate Change Affect the Ocean?
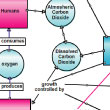
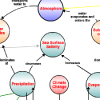
Scientist Helga do Rosario Gomes' map examines the effect of carbon dioxide on land and in the oceans. Beginning her map with
two sections, one being "good" ocean/carbon interactions, the other being "bad", Helga explores the positive and negative
sides of the carbon cycle including increasing acidification of the ocean due to elevated absorption of carbon. The consensus
map simplifies Helga's original vision, by focusing on ocean-related topics (leaving land-related topics for another map) and
rearranging the design so that the conseqences of varying carbon dixoide, temperature, and salinity are readily apparent ... [more]
Helga do Rosario Gomes | DMC Workshop
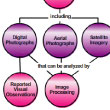
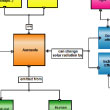
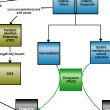
How Aerosols Affect Climate Change
Aerosols (suspended solid and/or liquid particles in air) vary in concentration over time and space and are generated naturally
(e.g., waves, sea salt, dust storms, volcanoes) and by human activities (e.g., factories, automobiles, burning). Scientist Hui
Feng uses aerosol measurements from satellites, aircraft, and ground-based technology to understand the impact of aerosol
variability on climate change and predict, via computer modeling, future climate conditions. The consensus map reorganizes Hui's
information for an 8th grade audience, allowing viewers to more easily tailor the content up or down grade levels ... [more]
Hui Feng | SSC Workshop
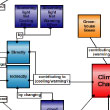
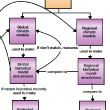
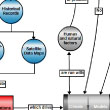
Climate Change Indicators
Scientist Liz Burakowski's original map focused on the identification of climate change indicators, which are used in
climate models to simulate future conditions. This allows researchers time to develop strategies to deal with potentially
undesirable circumstances. Working with her team of educators, Liz reconfigured her map to flow conceptually from
scientific concepts to the equations that drive climate models, while including the types of data that are used to create the
equations (i.e., records, instrument and satellite data) and delineating between natural and human-induced factors ... [more]
Elizabeth Burakowski | UNH Workshop Topic: Cycling in Earth Systems
(Click images to view and save maps)
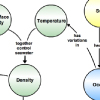
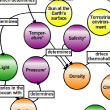
How Does Salinity Drive Ocean Circulation?
Sea surface salinity and temperature together control seawater density, which drives ocean circulation via horizontal
pressure gradients and water mass sinking. In this concept map, Scientist Michelle Gierach examines the role salinity
plays in ocean circulation and the affects this has on climate and biogeochemistry.
Michelle Gierach | JPL Salinity Workshop
What Are We Learning From Aquarius Data?
Now that measurements of global salinity are being regularly collected by Aquarius, what type of phenomena are being
observed with the data? In this concept map, Scientist Yi Chao highlights several months of data, focusing on interesting
regions of salinity change and what the data are already teaching us about the global ocean. Click here
for Yi's webinar (with Aquarius PI Gary Lagerloef) on what the data from this new satellite are telling us.
Yi Chao | JPL Salinity Workshop
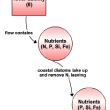
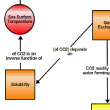
How a CO2 Source Becomes a Sink
In freshwater systems, such as the Amazon river, there is a net loss of CO2 to the atmosphere as water goes downstream -
making it a CO2 source. The river's flow contains nutrients that are taken out of the water as it moves downstream,
eventually depleting usable nitrogen. When a river like the Amazon reaches the ocean, a 'mesohaline' area (an area of medium
salinity) is created. Normally, this area would be a CO2 source (where more CO2 enters the atmosphere than is taken up)
because the nutrients would have been depleted enough so that blooms of phytoplankton cannot occur. However, at the
mesohaline area of the Amazon plume, symbiotic organisms known as Diazotrophs are able to flourish even though most of the
nitrogen has been removed from the system - because they are able to fix their own nitrogen from atmospheric N2. This
results in a bloom of Diatoms which eventually sink to the bottom of the ocean, making the unique area a "sink" for CO2.
Doug Capone | JPL Salinity Workshop
Understanding and Predicting Ocean-Ice Interactions
The formation and melting of land and sea ice impacts sea surface salinity, one of the components that drive ocean
circulation. Aquarius, a focused effort to measure sea surface salinity, is expected to fill in the gaps in computer models
related to ocean-ice interactions.
Dimitris Menemenlis | Aquarius Pre-Launch Workshop
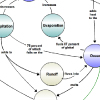
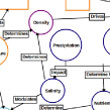
Oceanic and Atmospheric Affects on Climate Over Time
Scientist and Deputy Section Manager Victor Zlotnicki looks at how the oceans and atmosphere affect climate over time scales
ranging from a few hundred years to hundreds of years in this concept map covering a portion of the global water cycle.
Hover over the concepts to learn more about sea surface salinity, density, temperature, ocean circulation, and more!
Victor Zlotnicki | Aquarius Pre-Launch Workshop
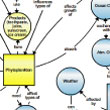
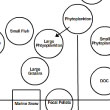
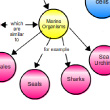
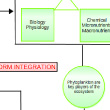
The Importance of Phytoplankton
Phytoplankton are closely tied to many environmental resources (e.g., oxygen, nutrients, fisheries, coral reefs) but also some
environmental problems, such as red tides and anoxia. Scientist Tim Moore's original map was designed to showcase the
relevancy of phytoplankton and their connection to humans, the atmosphere, and our oceans. The consensus map - rearranged to
emphasize the human element - was updated with an abbreviated marine food web to delineate the relationships between fisheries,
zooplankton, phytoplankton, and coral reefs ... [more]
Timothy Moore | UNH Workshop
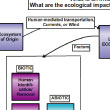
The Affect of Landscape on Coastal Waters
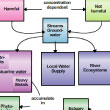
In her original map, Scientist Linda Kalnejais addresses how climate affects rainfall and groundwater and, by interacting
with the landscape, can carry particulates into estuaries and coastal waters. These particulates - which
include nutrients, pollution, organic matter, and other particles - can have both good and bad impacts on the environment.
For example, the right amount of nutrients can support healthy ecosystem growth but an
overabundance can lead to dead zones. The consensus map separates
human-induced and natural processes in an effort to delineate harmful and nonharmful particulates ... [more]
Linda Kalnejais | UNH Workshop
How Does Salinity Drive Ocean Circulation?
Sea surface salinity and temperature together control seawater density, which drives ocean circulation via
horizontal pressure gradients and water mass sinking. In this concept map, Scientist and Group Supervisor Tony Lee portrays
this connection and compiles applicable resources for further investigation.
Tony Lee | Aquarius Pre-Launch Workshop
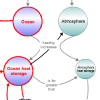
Climate and Heat Connections in the Ocean and Atmosphere
Sea levels around the world are rising and there is widespread consensus that substantial, long-term increases will
continue for centuries. Future sea level rise could cause potentially catastrophic difficulties for shore-based communities
and could displace many shore-based populations. In this concept map, Project Scientist Josh Willis looks at the
connections between climate and heat stored in the ocean and atmosphere and the cause and effect of ocean warming on sea level
rise.
Josh Willis | JPL Salinity Workshop
Sea Surface Salinity and the Global Water Cycle
Research Scientist Felix Landerer examines the role of sea surface salinity in our global water cycle in this concept
map created to celebrate the 2011 launch of Aquarius/SAC-D, a collaborative mission
between NASA and the Space Agency of Argentina. Hover over the concepts to uncover a wealth of assets - videos, images, news
articles, and resources - to learn more about the water cycle and the Aquarius instrument designed to measure the saltiness
of our seas.
Felix Landerer | Aquarius Pre-Launch Workshop
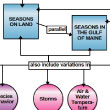
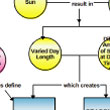
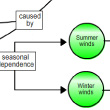
Seasons in the Gulf of Maine
Most of us know that variations in day length, incoming heat, and weather lead to seasons on land; however, there are parallel
effects in the ocean and coastal seas. In her original map, Scientist Deb Goodwin explains why there are seasons in the Gulf of
Maine, how seasonal variations affect environmental conditions, and how these are measured. The consensus map expands on her
original map with the addition of concept descriptions and links to videos, images, and other resources that can be used to learn
more about related topics ... [more]
Deb Goodwin | SSC Workshop
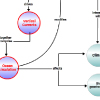
Climate Change and Ocean Biodiversity
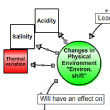
Scientist Collin Roesler's original map examines the connections between climate change and ocean biodiversity from the perspective
of variable environmental gradients (which affects which organisms survive in a given niche), the water cycle, and growth rates
in the marine food web. The consensus map focuses on how human activity is increasing carbon dioxide and temperature, both of
which affect ocean acidity and the growth rates of some organisms ... [more]
Collin Roesler | DMC Workshop
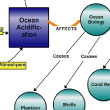
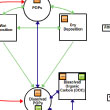
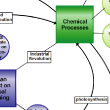
Key Concepts in Ocean Acidification
While there is some debate on the cause of global warming, most scientists agree that ocean acidification is primarily tied to
increases in atmospheric carbon dioxide caused by human activity. In his original map, Scientist Joe Salisbury discusses the carbon
cycle, an important concept because it modulates carbon dioxide, both biologically and physically, and thus affects the
concentration of acid in the ocean. The consensus map, created for a middle school audience, focuses on the activities that
produce carbon dioxide - burning of fossil fuels, land use, and cement production - as well as natural phenomina, and the impacts
of ocean acidification on three main receptors: plankton, shelled organisms, and coral reefs ... [more]
Joe Salisbury | SSC Workshop
Understanding Coastal Ocean Dynamics
Scientist Paul Choboter uses mathematical models (a set of equations that produce solutions) to evaluate topographic
influences on upwelling and associated currents off the California coast. His original map delineates the iterative
process of making, testing, and refining hypotheses and predictions and includes examples of topography (steep and
shallow slopes) that influence the origin and characteristics of upwelled water. The consensus map looks at why it's
important to understand coastal ocean dynamics and the causes of upwelling.
Paul Choboter | CalPoly Workshop
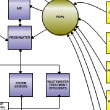
Fate and Transport of POPs
What happens to Persistent Organic Pollutants (POPs) once they are released into the environment? Scientist Penny Vlahos takes us
on a virtual journey as she describes in her original map the fate and
transport of these long-lasting chemicals once they are removed from global circulation and deposited in the atmosphere, biosphere,
and hydrosphere. A refocused consensus map illustrates where POPs come from (i.e. cosmetics, cleaning agents, packaging, etc.);
how they travel through the coastal environment; and how humans and wildlife are affected after consumption ... [more]
Penny Vlahos | UConn Workshop Topic: Marine Biology and Ecosystems
(Click images to view and save maps)
Ocean Circulation and the Movement of Organisms
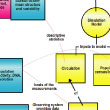
Scientist Jim O'Donnell's field is circulation and mixing in the coastal oceans. For his original map, he chose to concentrate
on a relatable problem: using circulation data to predict where a person could travel, via ocean currents, if lost at sea. Along the
way he addresses descriptive statistics used to characterize circulation, the basis of measurements (such as radio waves and
Doppler effect), and the fundamental aspects of simulation models (automation of forecasting systems, testing of models, and the
mathematics behind the models). The consensus map retains the same basic structure as the original map but focuses instead on the
movement of organisms in Long Island Sound ... [more]
James O'Donnell | UConn Workshop
Habitat Control
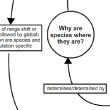
Why do species live where they do? Scientist Lars Tomanek and his team of educators look at the factors that govern
population habitat (physical and biological environments, physiology, species-to-species interactions, ecosystem,
service function, relevance to humans, food) and the cause and effect of changing conditions.
Lars Tomanek | CalPoly Workshop
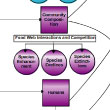
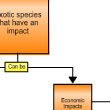
Establishment and Impact of Invasive Species
Scientist Kari Heinonen studies invasive species that are transported from their ecosystem of origin to another "recipient"
ecosystem by biologically or human-mediated means and/or physical forces. Her original map examines a number of factors that
determine whether or not an invasive species will become established in a new ecosystem and begin reproducing. The consensus
map builds on the original map with the introduction of color coding (to help readers sort the concepts into major categories) and
the addition of two new concepts to encourage discussion of invasive species mitigation ... [more]
Kari Heinonen | UConn Workshop
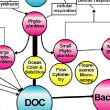
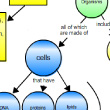
The Role of Microbes in the Carbon Cycle
The biological pump is the sum of a suite of biologically-mediated processes that transport carbon from the surface euphotic
zone to the ocean's interior. The pump represents how we believe organisms, microbial plankton in particular, can affect
the flow of carbon in the ocean. Scientist Mike Sieracki's concept map attempts to simplify this topic for college freshman with no
marine science background. Workshop educators streamlined his original map still further by adding more detail and emphasizing - with
weighted lines and color - the most important processes ... [more]
Michael Sieracki | DMC Workshop
Evolution and Impact of Toxin Resistence
Scientist David Avery's original concept map describes the effects of toxic phytoplankton blooms (also known as Harmful
Algal Blooms or HABs) on grazing animals - such as copepods - that eat toxic algae, and how these effects interact with the
ecosystem as a whole. The consensus map uses an alternative arrangement of concepts and paths that clarifies the scientist's
point of view for a younger audience ... [more]
David Avery | UConn Workshop
UVR Impacts on Sea Urchins and Humans
This pair of maps examines the impacts of ultraviolet radiation (UVR) on sea urchins, with an eye toward
understanding how human cells may respond to similar exposure. Good (photosynthesis, warmth, growth, increased
immunity) and bad (sunburn, cancer, morphological abnormalities, death) impacts are listed along with exposure targets
(organisms, populations, ecosystems) and potential defensive mechanisms.
Nikki Adams | CalPoly Workshop
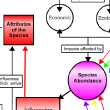
Invasive Species in Marine Environments
Scientist Lisa Needles' original map examines in detail the factors and processes that influence the abundancy of an
invasive species in a marine environment, including type of impact (economic, ecologic), species attributes (larval duration,
tolerance to physical stresses, propagules), transport mechanisms, and the attributes of the community (both biological and
physical). Lisa and her team's collaborative map complements the original effort by providing examples of invasive
species.
Lisa Needles | CalPoly Workshop Topic: Technology and Modeling
(Click images to view and save maps)
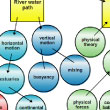
Using Computers to Model Pollutant Migration
It is well known that river plumes influence marine life, climate, and physical/chemical/geological dynamics, both close to the
river and hundreds of kilometers away. Scientist Mike Whitney spends a lot of time modeling coastal environments, and his original
concept map examines plume composition, fate, and transport; model design; and how models are used. The
consensus map follows a similar format but focuses on an example of pollutant transport to give students a clearer picture of how
river plumes can affect our daily lives ... [more]
Michael Whitney | UConn Workshop
Using New Technologies to Study Plankton
Scientist Mark Moline's concept map examines how new sensors and platforms (e.g., satellites, drifters, moorings, UUVs,
and models) contribute to our knowledge base of planktonic distributions in time and space. The consensus map expands upon
Mark's vision by defining relevent terminology, identifying the importance of plankton, and listing areas for further for
investigation for presentation to a younger audience.
Mark Moline | CalPoly Workshop
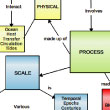
The Myth of the Single Model
What is a model? It is a mechanism we use to understand chemistry, physics, and biology through mathematical representations
of the real world. These are used to simulate nature and understand it better. And there's more than one. These
two maps delve into the factors - purpose, spatial scale, temporal scale, and process - that affect model selection ... [more]
Carolyn Jordan | UNH Workshop
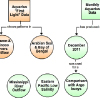
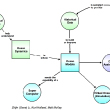
What Are Models and How Do They Work?
Scientist Zhijin (Gene) Li takes us through the process of building an ocean model, from data assimilation, prediction, and
comparison with real world phenomena to using theoretical work on ocean dynamics to power simulations. Click on the grey SPURS
concept in this map to see how ocean modeling is being used on NASA's
Salinity Processes in the Upper Ocean Regional Study.
Zhijin Li | JPL Salinity Workshop
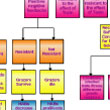
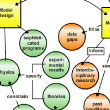
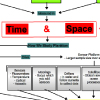
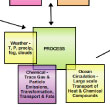
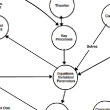
Modeling the Ocean-Climate System
Climate change models are based primarily on three main components: the atmosphere, ocean, and terrestrial parts of the earth
system. These components share and redistribute energy, water, and carbon - the key processes in our climate model.
This pair of maps addresses three questions posed by Dr. Fei Chai: 1) how are climate change/ocean climate models created and
how do scientists use them to predict climate behaviors, 2) where does the data used to power the models come from, and 3) what
processes or variables do scientists decide to include in their models ... [more]
Fei Chai | DMC Workshop |
|||||||||||||||||||||||||||||||||||||||||||||||||||||||||||||||||||||||||||||||||||||||||||||||||||||||||||||||||||||||||||||||||||||||||||||||||||||||||||||||||||||||||||||||||||||||||||||||||||||||||||||||||||||||||||||||||||||||||||||||||||||||||||||||||||||||||||||||||||||||||||||||||||||||||||||||||||||||||||||||||||||||||||||||||||||||||||||||||||||||||||||||||||||||||||


|
|||||||||||||||||


