Scientist-Educator Collaborative Workshop
Workshop Evaluation: Ocean & Climate Literacy |
|
Held at the Seacoast Science Center in Rye New Hampshire
Monday, June 1, 2009 through Wednesday, June 3, 2009 |
|
|
|
Using ocean and climate literacy principles that best align with the research areas of the workshop scientists, applicants are asked to rate
their comfort with and the relevance of the concepts to their own work. Following the workshop, educators are asked to indicate whether changes
occurred in their comfort with and their sense of the relevance of the same literacy concepts.
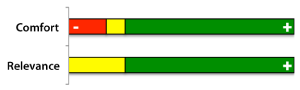
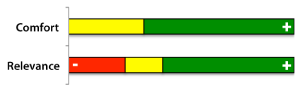
Literacy change data are presented in the charts below, color-coded as green ("preferred result"), yellow ("less preferred result"), and red
("negative result"). Our preferred result is: 1) they remained "very comfortable" with a principle or continued to find it "very relevant" after
the workshop; or 2) they were "more comfortable" with a literacy principle or felt it was "more relevant" after the workshop. Our less preferred
result is that the workshop failed to increase an initially moderate "comfort" or "relevance" rating for any principle. We consider any of the
following to be a "negative result": 1) a decrease in "comfort" or "relevance" after the workshop; or 2) their post-workshop status remained
either "somewhat" or "not" comfortable / relevant. To see a key with
this information, click here.
The degree to which comfort and relevance changed varied between concepts, some being less emphasized than others at the workshop. The following
chart provides a summary of those results ( download this chart as a PDF [194 KB]).
Airborne particulates, called 'aerosols', have a complex effect on Earth's energy balance: they can cause both cooling, by reflecting incoming sunlight, and warming, by absorbing and releasing heat energy in the atmosphere... |
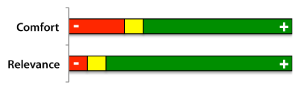 |
Scientific observations indicate that global climate has changed in the past, is changing now, and will change in the future. The magnitude and direction of this change is not the same at all locations on Earth. |
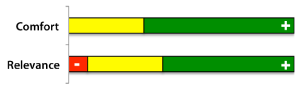 |
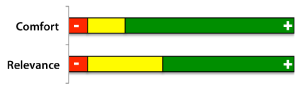
Observations, experiments, and theory are used to construct and refine computer models that represent the climate system and make predictions about its future. Results lead to better understanding of the links between the atmosphere-ocean system and climate conditions and inspire more experiments... |
 |
Human activities have affected the land, oceans, and atmosphere and these changes have altered global climate patterns. Burning fossil fuels, releasing chemicals into the atmosphere, reducing the amount of forest cover, and rapid expansion of development, and industrial activities� changing the balance of the climate system. |
 |
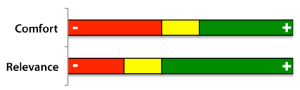
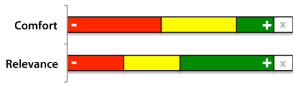
The chemistry of ocean water is changed by absorbing carbon dioxide from the atmosphere. Increasing carbon dioxide levels in the atmosphere is causing ocean water to become more acidic, threatening the survival of shell-building marine species and the entire food web. |
 |
The ocean dominates the Earth's carbon cycle. Half the primary productivity on Earth takes place in the sunlit layers of the ocean and the ocean absorbs roughly half of all carbon dioxide added to the atmosphere. |
 |
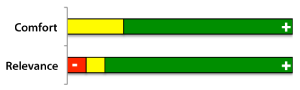
Most life in the ocean exists as microbes. Microbes are the most important primary producers in the ocean. Not only are they the most abundant life form in the ocean, they have extremely fast growth rates and life cycles. |
 |
New technologies, sensors and tools are expanding our ability to explore the ocean. Ocean scientists are relying more and more on satellites, drifters, buoys, subsea observatories and unmanned submersibles. |
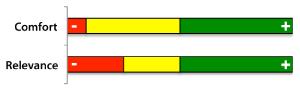 |
The ocean is connected to major lakes, watersheds and waterways because all major watersheds on Earth drain to the ocean. Rivers and streams transport nutrients, salts, sediments and pollutants from watersheds to estuaries and to the ocean. |
 |
Quotes from Workshop Participants
"I learned a great deal from Hui regarding this concept. Mapping it out gave me a broader understanding of the importance of teaching this
particular topic and now I have some great tools to do so."
"[Concept mapping] has great potential for use as a platform for establishing conversations between educators and scientists around ocean
and climate concepts!"
|


)