Scientist Collin Roesler explains the concept map and its development:
On my original "For Educators" map I put the broad topics in boxes in the left-hand
side of the map. The map is also color coded: planetary concepts are yellow, physical constraints are orange,
etc. Moving down from upper left, you see that changes in environmental gradients -- because of climate
change, for example -- will affect the environmental complexity of niches. This, in turn, will determine
which organisms survive in the environment/niche. Some organisms have very specific temperature range tolerances.
If they live in an area with a high temperature gradient (i.e., where temperature changes a lot over a relatively
small area), then movement of the organism -- or the gradient itself -- may be helpful or harmful. The balance
between the rate of environmental change and organisms' rate of adaptation determines the degree of biodiversity
in an area.
Focusing on the middle of the map, you see that sunlight travels through our atmosphere, bringing light to
Earth's surface and raising its temperature. The sun and atmosphere also control the water cycle. Precipitation
can bring nutrients and salts from the land to the ocean. Precipitation over the ocean can also affect the
saltiness -- or salinity -- of our seas. Both temperature and salinity are considered to be "state variables":
variables that describe the "state" of a dynamic system such as the ocean. In the ocean, a third important
"state variable" is pressure. Temperature, salinity and pressure -- color coded as purple -- together control
the density of ocean water. Density-driven circulation in the ocean is called "thermohaline" circulation.
Ocean circulation is also linked to earth's atmosphere because sea surface currents are also driven by winds.
Wind-driven ocean currents are key to moving nutrients to the sunlit ocean surface, providing a source of energy
for ocean primary production. Nutrients also provide "building blocks" for organisms higher up the food chain.
The bottom right half of the "For Educators" map focuses on growth rates within the marine food web. The maximum
(i.e., "gross") growth rate is decreased by the biomass loss rate: together these result in a net growth rate.
The physical and environmental conditions determine which organisms survive and where they flourish and grow:
in other words, the biodiversity of an area. In general, the more complex an environment, the more biodiversity.
Less complex environments have lower biodiversity. We don't know how climate change will affect future
environmental complexity. But we do know that if the environment changes faster than organisms can adapt,
biodiversity will decrease. Also some types of organisms -- such as bacteria -- can adapt relatively quickly.
Other types of organisms -- polar bears, for example -- are not as able to adapt to rapid environmental change.
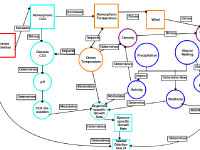
As a team, the educators and I created our consensus map. We focused on how human activity is increasing carbon
dioxide and temperature, both of which affect ocean acidity and some organisms' growth rates. Even with this
seemingly "simple" process, we were able to include many environmental factors such as wind, precipitation,
glacial melting, sea level, salinity, density, circulation, and nutrients. I really learned a lot from the
educators about communicating with pre-college students. I even plan to use their "pointers" -- and our
consensus concept map -- in my undergraduate teaching.
|


