Scientist Helga do Rosario Gomes explains the concept map and its development:
I started off my concept map looking at a specific question about how carbon dioxide can affect the ocean's
ability to change, store and absorb heat. As I went through the concept mapping process, I realized that it was
better to start broad, and then work more thoroughly on certain areas of the map.
My question changed from the specific topic of how climate change would affect the ability of the ocean to
absorb and store heat to a broader one about carbon dioxide's effects on both land and in the oceans. In the 1980's
and 1990's, it was widely believed that the ocean's role in the carbon cycle was to absorb carbon dioxide, which
was viewed as a positive thing. So in my map, I started with two sections, one being "good" ocean/carbon
interactions, the other being "bad". But as you explore the topic further, you realize that there are positive
and negative sides to each part of the cycle. For example, oceans absorb carbon but we now know that it is
contributing to ocean acidification. Also, ice melt may have consequences on salinity, affecting global ocean
circulation.
I can see where my map would connect with Colin's, especially in the areas of the effects on plant life on land
from some of these changes as well. I hope to take more time to fully explore many parts of these ocean and
climate interactions, especially concerning carbon inputs.
My education team helped me simplify my concept map by focusing on ocean-related topics (leaving land-related
topics for another map) - this made it easier to follow as they organized it starting at the top of the page
and flowing to the bottom. The focus question was simplified to, "How does climate change affect the ocean?" and
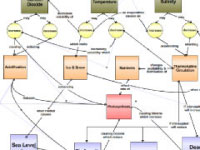
was designed with freshmen or sophomores in high school as the target audience. The educators chose to start with
three main concepts at the top: ocean carbon dioxide, ocean temperature, and ocean salinity, and kept my patterns
of positive and negative feedbacks of these concepts on the next level of physical concepts - ranging from ocean
acidification, nutrients, ice & snow to thermohaline circulation.
Students are always interested in the effects on biological systems, so the bottom level of concepts is dedicated
mainly to effects of climate change on processes such as photosynthesis, and organismal growth (biomass) and
the biodiversity of organisms in ocean ecosystems. I really like how this map has evolved from when I started on
the first day of the workshop - it is much more accessible and engaging to high school students as a result of
the interaction with our education team (Laura Woods and Sue Klemmer).
|
<br />on the first day of the educator-scientist climate change workshop','Concept map'))
)
)