SEARCH AEROSOLS & CLIMATE CHANGE
WORKSHOPS
 
Scientist-Educator Collaborative Workshop
What Are Aerosols and How Do They Affect Climate Change?
Held at the Seacoast Science Center in Rye New Hampshire
Monday, June 1, 2009 through Wednesday, June 3, 2009
EVOLUTION OF THE CONCEPT MAP
Click Images to Enlarge
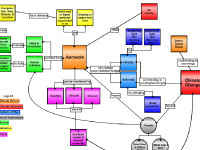
Original concept map created by Hui Feng
Digital concept map created in the COSEE Concept Map Builder
Consensus concept map created using the COSEE-OS Concept Map Builder
Click Buttons for
Presentation Videos & Maps

About this Workshop:
For this workshop, 12 informal educators from the New England area (including the Seacoast Science Center and New England Aquarium) were matched with ocean and climate scientists from the University of New Hampshire to improve their collective understanding of Earth's climate and ocean systems. [more]

About this Scientist:
Hui Feng's research is in the field of ocean color remote sensing, hydro bio-optics and radiative transfer in optically-complex waters. Specifically, his focus has been on the development of ocean color inversion algorithms to retrieve in-water bio-optical properties, and the evaluation of ocean color atmosphere correction performance in coastal regions using in-situ atmospheric and aquatic optical measurements. A recent research focus involves the sea state bias modeling for altimeter range correction by using global ocean surface wave model and scatterometer data. [more]
Click Images to Learn More About the Educators
Who Worked on this Concept Map
 
 
Carrie Armbrecht
Kate Leavitt
 
 
Hui Feng
 
Scientist Hui Feng explains the concept map and its development:

I first learned about the technique of "concept mapping" during the workshop's scientist training session. The topic I mapped is: "How do Aerosols Impact Climate Change?" I started by putting "Aerosols" in the middle of the map. Above this are the two concepts that define what aerosols are and that concentrations of aerosols vary over time and space. At bottom I address the processes that generate aerosols: natural (e.g., waves, sea salt, dust storms, volcanoes) or human activities (e.g., factories, automobiles, burning). Aerosols are connected to climate change by changing solar radiation, either directly or indirectly. Direct examples include scattering and absorption of light. Indirect effects are mainly related to cloud formation in earth's atmosphere which affects how energy in the atmosphere is distributed. At left, I have sensors that are used to monitor aerosols, including satellites, aircraft, and ground-based technology. These data are fed into computer models to understand the impact of aerosol variability on climate change, models that are being used to predict future climate conditions.

The educators on my team each works with very different audiences. So we decided to make our consensus map with an 8th graders in mind and made the wording generally more "user friendly." We felt that targeting this group will allow each of us to tailor the content up/down for different audiences. We also slightly altered the focus question to: "What are Aerosols and How do They Impact Climate Change?" so users would know that the map included basic information about aerosols. We reorganized the map and added a color-coded legend to make it easier to read. For emphasis, we made the squares for "Aerosols" and "Climate Change" larger than the others. One important change is that we added more information to the concepts of "Scattering light" and "Absorbing light," noting that the former results in net cooling while that latter results in net warming. Another point that came up during our conversations was the fact that the "Composition, Size, Shapes & Location" of aerosols are determined by the processes that generate them. We also added two new concepts that are familiar to lay people: "Air Quality" and "Greenhouse Gases." Likewise, we noted that "People" are affected by aerosols and can do something to about mitigating their impacts on climate.
View All Concept Maps Created at this Workshop
Concept map