SEARCH INDICATORS OF CLIMATE CHANGE
WORKSHOPS
 
Scientist-Educator Collaborative Workshop
How are Plants Indicators of Climate Change, and How Can We
Observe and Measure Climate Change Locally?
Held at the Seacoast Science Center in Rye New Hampshire
Monday, June 1, 2009 through Wednesday, June 3, 2009
EVOLUTION OF THE CONCEPT MAP
Click Images to Enlarge
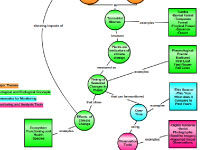
Original concept map created by Annette Schloss
Digital concept map created in the COSEE Concept Map Builder
Consensus concept map created using the COSEE-OS Concept Map Builder
Click Buttons for
Presentation Videos & Maps

About this Workshop:
For this workshop, 12 informal educators from the New England area (including the Seacoast Science Center and New England Aquarium) were matched with ocean and climate scientists from the University of New Hampshire to improve their collective understanding of Earth's climate and ocean systems. [more]

About this Scientist:
Annette Schloss works with scientists, teachers and informal educators to bring global climate change data and research discoveries into classrooms, informal science centers, and citizen monitoring groups.

At the University of New Hampshire, Annette manages EOS-WEBSTER, a large digital library of local, regional and global Earth Science Data, and has been behind the scenes in online tools for visualizing coastal ocean satellite imagery and sea ice imagery in the polar regions, Landsat images for studying vegetation and the GLOBE Carbon Cycle Project. She's also working on a new Picture Post initiative to help citizens and monitoring groups to use digital photography for observing change-over-time in their own environment. [more]
Click Images to Learn More About the Educators
Who Worked on this Concept Map
 
 
Jayshree Oberoi
Betsy Stefany
 
 
Annette Schloss
 
Scientist Annette Schloss explains the concept map and its development:

My research focuses on biomes: broad categories of vegetation that depend on climate, elevation, etc. For this workshop, I was asked to make a "concept map," a technique I had not used before. I began by creating a map that shows how changes in biomes can be measured locally and how such observations -- which can be made by almost anyone -- can be tied to regional climate change. The map I presented to the informal educators was designed to outline the process of tying observations of change in local vegetation to climate change. In addition to our own observations by eye, we can use use various tools to monitor change, including picture posts (i.e., taking a time series of pictures from the same "post"). These pictures can be compared to aerial photographs and satellite images to understand regional or global trends. We can also connect to other data such as temperature and precipitation records, opening up a whole arena of connecting local to regional to global observations.

One reason I encourage "observing our own backyards" is that we tend to hear about climate change impacts in faraway places: for example, the polar regions and the tropics. My hope is that a focus on a local and regional examples of climate change will empower citizens to make change where they live. The map I presented to educators addressed two questions: "How do biomes express regional & global climate & climate change?" and "How do we observe & measure change locally?" Climate change is the main concept and is observed at local/regional/global scales. "Terrestrial biomes" -- including tundra, boreal forest, temperate forest, tropical forest, savanna, desert -- have many examples of change that can be easily observed. We can monitor the date of the first leaves on trees, first buds appear on flowers, when leaves change color in fall, etc. Comparing the timing of of this year's events to past years, we can start looking at the broader effects. For example, it has been shown that northern boreal forests are "greening" (i.e., spring is arriving) 10 days earlier than the recent past. Because of this, birds are arriving at the wrong time and missing the best food resources and becoming more susceptible to predators. Over long term, these shifts will affect the birds' reproductive success.

Working the educators, we discussed the various types of audiences that might want to learn about this topic and decided to create a map targeted at the 8th grade level. We used the term "biomes" instead of "plants" since the latter is more familiar. We also used color coding to distinguish "Major Themes," "Biological and Ecological Concepts," "Timescales for Monitoring" and "Monitoring and Analysis Tools." We also came up with two new focus questions: "How are plants indicators of climate change?" and "How do we observe plants & measure climate change locally?" On our consensus map, "Climate Change" is shown to be observed local/regional/global scales and also seasonally and and year-to-year. We made separate squares to give specific examples of terrestrial biomes and timing of seasonal change in plants. We also emphasized that effects of climate change include ecosystem functioning and species' health.
View All Concept Maps Created at this Workshop
Concept map