SEARCH OCEAN ACIDIFICATION
WORKSHOPS
 
Scientist-Educator Collaborative Workshop
What Key Concept is Important for Your Audience to
Know About Ocean Acidification?
Held at the Seacoast Science Center in Rye New Hampshire
Monday, June 1, 2009 through Wednesday, June 3, 2009
EVOLUTION OF THE CONCEPT MAP
Click Images to Enlarge
Original concept map created by Joe Salisbury
Digital concept map created in the COSEE Concept Map Builder
Consensus concept map created using the COSEE-OS Concept Map Builder
Click Buttons for
Presentation Videos & Maps

About this Workshop:
For this workshop, 12 informal educators from the New England area (including the Seacoast Science Center and New England Aquarium) were matched with ocean and climate scientists from the University of New Hampshire to improve their collective understanding of Earth's climate and ocean systems. [more]

About this Scientist:
Joe Salisbury works on carbon cycling in the coastal ocean. His main interest regards how biological processes and land-ocean interactions affect carbon cycling in coastal waters. He is also interested in ocean acidification, and uses remote sensing data to try to understand these processes.

Joe is presently working on two strands of research. The first seeks to characterize distributions of carbon dioxide, air-sea carbon exchange and productivity in riverine-influenced coastal regions. The second involves the use of data from a variety of space-borne sensors to identify and classify estuarine and river plumes of the world.

Joe is also interested in developing more advanced plume detection methodologies in order to efficiently study the biogeochemical dynamics of plumes at broad spatial scales. CCTI projects that show promise involve the coupling of physical flow fields with ocean color data to study the trajectory and persistence of surface plumes, and the use of MODIS fluorescence data to help segregate river-derived constituents from biomass produced in-situ. [more]
Click Images to Learn More About the Educators
Who Worked on this Concept Map
JB Kavaliauskas
Diana Payne
Nicole Scola
Joe Salisbury
 
Scientist Joe Salisbury explains the concept map and its development:

I made this map a year ago, for another COSEE-OS workshop, and looking at it again, I would change some things. The map is really addressing "What's important to know about ocean acidification?" It is important to know is that ocean acidification is primarily occurring about because of increasing carbon dioxide concentrations in the atmosphere. And while there is some debate on what's causing global warming, 99.9% of scientists agree that human activity the cause for increasing atmospheric carbon dioxide. So the "take home message" is that ocean acidification is primarily tied to increases in atmospheric carbon dioxide and that's being caused by human activity.

It's also important to realize that every concept on this map can be connected in some way; however, I feel that decreasing the numbers of connections on this type of map can help to improve its clarity. Global change is affecting levels of carbon dioxide. It's also probably increasing sea temperature and the gas exchange of carbon dioxide into ocean water as a function of increased storminess and winds. When carbon dioxide gas gets into the ocean -- e.g., by winds -- it dissociates or creates an acid: the more carbon dioxide, the more acid. The "Carbon Cycle" is also an important concept because it modulates carbon dioxide, both biologically and physically. So anything that changes productivity in the ocean also affects the concentration of acid in the ocean. Ocean acidification can affect life: primarily life that creates shells out of calcite or aragonite such as clams, mussels, coral reefs, pterpods (i.e., a type of shelled mollusk). Lab studies have shown that many shelled animals are very sensitive to small increases in acidification: it makes them "work harder" to make a shell.

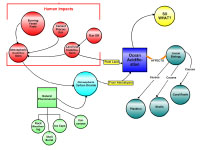
The informal educators I worked with do a lot of professional development with classroom educators. We discussed that these maps -- and the process of creating them using COSEE-OS tools -- can help cultivate and nurture dialog between scientists, informal and formal educators. In terms of my original map, we decided to "start from scratch" and focus on: "How do Humans impact ocean acidification and what are the consequences?" for an audience of 8th grade science teachers (and their students). We spent quite a bit of time making sure that we used the appropriate vocabulary. We decided that "Human Impacts" is a good "hook," so we colored these concepts in bright red. On the map, the size of circle represents the relative size of that item's contribution.

In addition to fossil fuels and land use, we brought in cement production as a key contributor. These all contribute carbon dioxide to the atmosphere but, to be clear, we also added the natural phenomena that contribute carbon dioxide to the atmosphere (shown in green). In terms of the impact of ocean acidification, we focused on three main "Ocean Biology" topics: plankton, shelled organisms, and coral reefs. When you "roll over" these, you can see brief descriptions of which organisms are affected by ocean acidification and how: e.g., rolling over "plankton" reveals various plankton types and how ocean acidification can lower plankton metabolism and reproduction rates. In the upper right of the map, we added: "So what?" to prompt people to think about ways they can change their own behavior to help mitigate consequences.
View All Concept Maps Created at this Workshop
Concept map