SEARCH WATERSHEDS & CLIMATE CHANGE
WORKSHOPS
 
Scientist-Educator Collaborative Workshop
How Do Watersheds Affect Climate Change?
Held at the Seacoast Science Center in Rye New Hampshire
Monday, June 1, 2009 through Wednesday, June 3, 2009
EVOLUTION OF THE CONCEPT MAP
Click Images to Enlarge
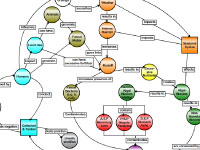
Original concept map created by Ru Morrison
Digital concept map created in the COSEE Concept Map Builder
Consensus concept map created using the COSEE-OS Concept Map Builder
Click Buttons for
Presentation Videos & Maps

About this Workshop:
For this workshop, 12 informal educators from the New England area (including the Seacoast Science Center and New England Aquarium) were matched with ocean and climate scientists from the University of New Hampshire to improve their collective understanding of Earth's climate and ocean systems. [more]

About this Scientist:
Ru Morrison has been involved in the Integrated Ocean Observing System (IOOS), which is a network of tools that collect and provide data for marine activities, and relies on outreach. He is the director of the Northeast Regional Association of Ocean Observing Systems (NERACOOS), a growing Ocean Observing network serving the Gulf of Maine and Northeast.

Ru's interests focus on using bio-optical techniques to study biogeochemical processes in the ocean. His research can be divided into two main categories that are not mutually exclusive: (1) the study of the temporal and spatial variability of optically important constituents and (2) phytoplankton photophysiology and ecology. To answer questions within these research categories I use both in-water optical measurements and ocean color remote sensing. [more]
Click Images to Learn More About the Educators
Who Worked on this Concept Map
 
 
John Diamond
Aimee Hayden-Roderiques
 
 
Ru Morrison
 
Scientist Ru Morrison explains the concept map and its development:

I have been making concept maps since childhood. I tend to use them when I'm thinking through complex processes and want to organize my thoughts in a graphical way. The original map, "How do Watersheds Influence Our Oceans and Climate?," was rather complex but the central point of entry was "Runoff." Above that are the things that determine type of runoff, including "Watershed Characteristics" and amount of "Precipitation." Watershed characteristics are mainly determined by land use (e.g., by humans) and the area. Climate change can impact not only watershed characteristics but also the frequency and intensity of major storms. Effects of runoff seen are on the bottom half of my map, particularly what is contained in runoff water. At far right is a question mark which is connected to "ocean acidification" and can negatively impact the growth of shellfish, a very active area of research nowadays. A better understood relationship is between nutrients and algal blooms. On the positive side, algal blooms nourish the base of the marine food web. On the negative side, too many nutrients can lead to huge algal blooms which, upon dying, can cause "Dead zones." Three of the concepts on this map are tied directly to "Water Clarity": algal blooms, dissolved matter, and particles. Each of these can reduce the amount of sunlight reaching the sea bottom and damage eelgrass. At far left on my map, pollution can contain lead and fecal bacteria, which can directly harm fish, shellfish, and humans.

The informal educators and I decided focus on climate change impacts that are important to New England shellfisheries. Our consensus map shows that climate change can lead to short, intense storms that result in runoff with high levels of fecal bacterial and excessive nutrients. The nutrients can lead to Harmful Algal Blooms that contain toxins -- such as Amnesiac Shellfish Poisoning (ASP), Paralytic Shellfish Poisoning (PSP), and Diarrhetic Shellfish Poisoning (DSP) -- that can be concentrated in shellfish. The left side of the map illustrates the process of collecting and testing shellfish to determine whether or not they are safe to be consumed by humans. "Humans" are an important part of the "process loop" as their activities -- including "Land Use" by livestock animals -- can add fecal matter to the runoff and contaminate shellfish.

Aimee Hayden-Roderiques works at the Maine Department for Marine Resources that is responsible for monitoring shellfish beds, including the decision if they need to be closed for public health reasons. She will use our consensus map with people ages 10 and older. John Diamond volunteers at the Seacoast Science Center and is also a Docent in the University of New Hampshire Marine Program. He will use the map as a standalone resource to complement existing exhibit content.
View All Concept Maps Created at this Workshop
Concept map