Scientist Deb Goodwin explains the concept map and its development:
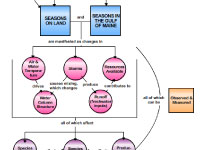
The initial map I prepared for the educators started with the underlying reason we have seasons: the tilt of our planet's
rotation axis (relative to the Earth-Sun plane) causes places on the globe to have differing amounts of sunlight over
a year. Most of us know that variations in day length, incoming heat, and weather lead to seasons on land; however,
there are "parallel" effects in the ocean and coastal seas such as the Gulf of Maine. This variation in environmental
conditions affects the biological organisms that live in the Gulf of Maine, impacting which species are present and how
they behave from season-to-season. In terms of environmental conditions, seasonality drives the severity of storms that
can cause mixing of ocean waters. Likewise, the heating (or cooling) of the ocean surface by sunlight (or lack thereof)
can affect the density of the surface waters, driving the overall water column structure. Resources for living
organisms -- such as nutrients and oxygen -- also vary seasonally. An important thing to note is that, like on land,
ocean conditions can be measured: using tools such as rain gauges, buoys, thermometers, etc.
Working with the educators, we decided to physically rearrange many of the concepts on my original map. In doing so, we
took great care to label arrows to indicate direct causality versus an indirect effect or an association. We found
that spending a lot of time on these "linking phrases" helped us discuss the scientific basis for the map in depth
and helped us communicate with each other in a clear and concise way. The true "entry point" for our map are the two
parallel squares: "Seasons on Land" and "Seasons in the Gulf of Maine." Below this, we show how air/water temperature,
water column structure, storms, runoff, and resources are interrelated. We decided to enclose all of these in a u-shaped
bracket, as all of these help drive the biological responses, which are shown directly below. At right, we used
a curved arc to indicate physical and biological conditions that are observed and measured on a long term basis.
We found a neat "trick" for expanding the information associated with the concepts: we added descriptions so that when
a user rolls over the concepts, the explanation "pops" up. Also, when viewed online, users can click on the concepts
to find the videos, images, and the other resources we added.
Overall, I was happy to discover that this product could be used by the informal educators for topics ranging from
tidepool seasonality to the water cycle. By having a clear understanding of the map we created, each of use will use it
as a starting point for working with various audiences in the future.
|
 on the<br />first day of the educator-scientist collaborative workshop','Concept map'))
)
)