SEARCH HOW CHANGE AFFECTS MARINE FOOD WEBS
WORKSHOPS
 
Faculty/Graduate Student Collaborative Workshop at the DMC
Workshop Theme: Ocean-Climate Connections
Held at the Darling Marine Center in Walpole, ME
Friday, January 29, 2010 and Monday through Tuesday, February 1-2, 2010

EVOLUTION OF THE CONCEPT MAP
Click Images to Enlarge
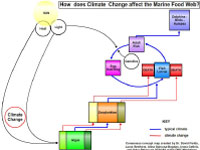
Original concept map created by David Fields
Digital concept map created in the COSEE Concept Map Builder
Consensus concept map created using the COSEE-OS Concept Map Builder

About this Workshop:
For this workshop, 15 graduate students from UMaine and 2 post-doctoral researchers were matched with New England-region ocean and climate scientists to improve their collective understanding of Earth's major ocean - climate systems. [more]

About this Scientist:
David Fields is a marine biologist in general, and more specifically, a chemo- and mechano-sensory ecologist. He studies the environmental factors (chemicals, physical movement) that influence plankton behaviors at the small scales at which plankton live (micrometers to meters).

Dave's research projects investigate the role of chemical and fluid mechanical signals in mediating zooplankton behavior. He is interested in the fine scale structure of signals, how signals are detected, zooplankton behavioral responses to fluid signals, and how zooplankton behavior is manifested in their local and global distribution. This work combines small-scale fluid mechanics, neurophysiology and animal behavior and information derived from examining small-scale interactions is applied towards understanding plankton large-scale distribution patterns. [more]
Click Images to Learn More About the Students
Who Worked on this Concept Map
Laura Brothers
Ivona Cetinic
Alina Gainusa-Bogdan
Artur Palacz
David Fields
 
Scientist David Fields explains the concept map and its development:

As I pondered how to best address my initial focus question - "How do changes in temperature affect planktonic food webs?" - I struggled to find a way to clearly display timing of multiple linked events on my concept map. The story I want to share deals with the influence of changing environmental temperatures on the delicate cascade of trophic events involving a small section of the oceanic food chain: phytoplankton, zooplankton and fish. Some events in this food chain are coupled tightly to temperature and sunlight fluctuations, but some are not - making them particularly vulnerable to changing climate conditions. Fisheries and ecosystem managers are particularly interested in being able to predict - and hopefully mitigate if possible - these "perturbation points" as climate change starts to impact ocean ecosystems.

I started with the sun as a major concept on my map - both sunlight and temperature (e.g., seawater warmed by the sun) directly influence the life cycles and growth rates of phytoplankton at the base of the food chain. The sun also contributes to ocean layering (e.g., stratification). Strong stratification helps retain the phytoplankton in the upper water column where they receive more warmth and light. Moving up the food chain, zooplankton life cycles and growth rates are tightly coupled to both water temperature and to the availability of their food (i.e., phytoplankton). Ideally, the majority of zooplankton would hatch and start to feed "on time" during the period of maximum phytoplankton abundance, as opposed to "too early" or "too late". However, the next event at a higher food chain level - the hatching of fish eggs - is not coupled tightly to environmental conditions, but is instead a result of evolution (i.e., has a genetic component).

Let's throw changing "ocean climate" conditions into this food chain scenario and see which trophic levels and life stage events are most affected. As water temperatures increase, lower trophic levels (i.e., phytoplankton and zooplankton) will bloom sooner in the year, but they will stay tightly coupled in timing to each other. However, the higher trophic level (i.e., fish) are not coupled to water temperature, so they would be predicted to miss the main growth pulses of their food sources - causing their populations to decline.

On day two of the workshop, our team streamlined our consensus map so that the story of food chain connections and population growth over time was more accessible to our target audience - freshman in college with no marine science background. We restated our focus question and removed all time-related concepts from each trophic level and replaced them with easy-to-follow red and blue lines. We retained the progression of time (from left to right) and increase in trophic levels (from bottom to top). Blue lines connect maximal population abundance and maximum trophic transfer: "good timing" during typical climate conditions. Red lines connect populations that are "out of synch" (due to climate change) and ultimately lead to large fish larvae mortality: "bad timing" when larvae hatch and develop too late in the season to feed well on the shifted algal bloom, so a large majority of them starve. We also added a very clear link from adult fish to higher trophic levels of humans, dolphins and birds.
View All Concept Maps Created at this Workshop
Concept map