SEARCH BENTHIC ORGANISMS' ROLES & RESPONSES TO CHANGE
WORKSHOPS
 
Faculty/Graduate Student Collaborative Workshop at the DMC
Workshop Theme: Ocean-Climate Connections
Held at the Darling Marine Center in Walpole, ME
Friday, January 29, 2010 and Monday through Tuesday, February 1-2, 2010

EVOLUTION OF THE CONCEPT MAP
Click Images to Enlarge
Original concept map created by Peter Jumars
Digital concept map created in the COSEE Concept Map Builder
Consensus concept map created using the COSEE-OS Concept Map Builder

About this Workshop:
For this workshop, 15 graduate students from UMaine and 2 post-doctoral researchers were matched with New England-region ocean and climate scientists to improve their collective understanding of Earth's major ocean - climate systems. [more]

About this Scientist:
Peter Jumars is a benthic physical ecologist in that he studies the interface between individual organisms and physical, chemical and geological processes. His interests extend to populations, communities and ecosystems, but are "unabashedly reductionist" and focused on mechanism.

Pete and his lab group strive to identify quantitative physical, chemical and geological constraints that can be measured or calculated in order to bound the rates of processes in which marine organisms participate. Current projects include effects of unsteady flows at low Reynolds numbers on phytoplankton, interactions between burrowing and digestion in deposit feeders with physical and chemical properties of sediments (with L. Mayer), and effects of organisms and their structures on propagation of sound in and near the seabed (with the idea of using sound to infer abundances, activity levels and behaviors). [more]
Click Images to Learn More About the Students
Who Worked on this Concept Map
Nicolas Record
Ian Salter
Kristen Wilson
Peter Jumars
 
Scientist Peter Jumars explains the concept map and its development:

My initial overarching focus question was: "What is the role of benthic organisms in the global carbon dioxide cycle? How do they respond to change?"

If you don't understand how the carbon cycle works in its entirety, you can start with a smaller piece of the puzzle - by learning how benthic marine organisms are connected to each other and play an important role in the carbon dioxide cycle. Benthic is a word that describes the bottom of the ocean. It is important to know that 99% of the sea floor is composed of mud. Examples of benthic organisms include clams, scallops, sea stars, hermit crabs, worms, sea slugs, sponges (and more!) The concept maps I helped to create in this workshop attempt to explain how environmental processes and disturbances affect benthic organisms that either successfully or unsuccessfully adapt to these changes.

With reflection upon my first concept map, I realized that this version was really more of an "assigned diagraph" than a true concept map - although they are very similar in some respects. This approach represented to me the best way to include all the detailed information I wanted to share in order to answer my focus question - at first pass. I used blue colors to indicate abiotic variables (e.g., grain size, light levels), and red colors to indicate biotic variables (e.g., predator and prey abundances). The diagraph depicts a whole system of variables that determine the abundance of "species X" - broken down into individual interactions with positive (+) or negative (-) effects depicted between concepts connected by linking lines with arrows. To be more specific, arrows point from the "causal variable" concept to its "affected variable" concept. For example, increases in streambed flow rates cause water column turbidity to also increase - equaling a positive (+) relationship. Some interactions can be two-way (instead of one-way) and are more complex: an arrow that shows negative effects in both directions would represent competition (e.g., increases in a competitor's abundance would mean decreases in species X's abundance, and vice versa) In hindsight, I see that change between variables can be more easily shown in a graphical representation (x and y axis plot) although a concept map can show relationships between multiple concepts to each other which is what I mean to do here.

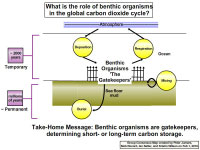
As I worked with my team members on day two of the workshop to build a consensus map for new target audience (high school freshman), we decided to find a way to simplify the story a bit and highlight one portion of the global carbon cycle in which benthic organisms play a key role: transition of carbon into or out of the marine sediments. The five main processes presented in the final map include deposition, burial, mixing and respiration. Our map took on a completely different look as we thought about how best to address our audience and drive home one key message. Certain benthic organisms are indeed "gatekeepers". They can determine through their behaviors at the seafloor (e.g, bioturbation, burrowing) if temporary carbon deposition is left undisturbed for eventual permanent burial (deep sequestration), or if it is returned to the water column carbon pool. We also added the dimension of time in the form of "storage times" on the left-hand side of the map to further define the terms "temporary" versus "permanent" carbon storage for our audience.
View All Concept Maps Created at this Workshop
Concept map