SEARCH STORAGE OF CO2 IN SOILS & SEDIMENTS
WORKSHOPS
 
Faculty/Graduate Student Collaborative Workshop at the DMC
Workshop Theme: Ocean-Climate Connections
Held at the Darling Marine Center in Walpole, ME
Friday, January 29, 2010 and Monday through Tuesday, February 1-2, 2010

EVOLUTION OF THE CONCEPT MAP
Click Images to Enlarge
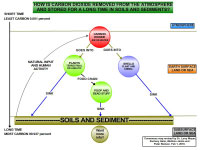
Original concept map created by Lawrence Mayer
Digital concept map created in the COSEE Concept Map Builder
Consensus concept map created using the COSEE-OS Concept Map Builder

About this Workshop:
For this workshop, 15 graduate students from UMaine and 2 post-doctoral researchers were matched with New England-region ocean and climate scientists to improve their collective understanding of Earth's major ocean - climate systems. [more]

About this Scientist:
Lawrence Mayer is a biogeochemist - that is, he studies how organisms and materials (studied chemically) interact in earth surface environments. He and his lab use the concepts and tools of chemistry, geology and biology in these studies, placing special focus on the comparison and coupling of oceanic to terrestrial processes.

One major topic Larry studies is the bioavailability of nutritional and toxic materials (e.g., how organisms are able to glean nutrients from or be exposed to toxins) in an environmental matrix such as water or sediment. His group also studies the global carbon cycle with a focus on how the interaction between organic matter and minerals enables preservation and/or burial of organic carbon in the ocean. [more]
Click Images to Learn More About the Students
Who Worked on this Concept Map
Zachary Helm
Mahima Jaini
Peter Stetson
Lawrence Mayer
 
Scientist Lawrence Mayer explains the concept map and its development:

My original focus question was "How is Carbon Dioxide (CO2) Taken from the Atmosphere and Put into the Ocean Sediments by Biological and Geological Processes?" My original map had a "geographical element": concepts at the top of the map reflected processes that happen in the atmosphere and concepts at the bottom depicted processes that occur at the ocean floor. The overall idea is that we have CO2 in the atmosphere and it can also be dissolved in ocean water. There are processes that can take CO2 and "transform" it into forms that can get buried for a long period of time. One important "pathway" is absorption of CO2 by plants that are eaten by consumers that die and can eventually become buried. Another important "pathway" is absorption of CO2 into the shells of some organisms.

When I presented my original concept map to fellow scientists, they had a lot of helpful comments. I had tried to use simple, understandable "linking phrases" between my concepts. However, some of my original concept terms were not at the right level for high school students, so we discussed options for more audience-appropriate terms. One scientist pointed out that my original map implied that once CO2 is buried it never goes back into the atmosphere. I did this to reflect the map's "focus question" (above). In reality, processes such as oil extraction and fossil fuel burning do pull carbon dioxide from long-term reservoirs and put them back into earth's atmosphere.

In my presentation to the graduate students and post-docs, I emphasized how CO2 relates to climate change and other issues that people are concerned about. I talked about three distinct regions where carbon dioxide is found: (1) air at the top of the map; (2) earth's surface - where we live on land, swim in the oceans, etc.-in the middle of the map; and (3) the long-term storage deep beneath continents and oceans at the bottom of the map. I used some familiar experiences -- such as the fizzing that occurs when you open a bottle of soda - to illustrate that CO2 can go from being dissolved in a liquid to being released to the atmosphere.

In discussion with the graduate students (i.e., Mahima, Peter, and Zachary), we decided that doing a little "demo" about the length of time CO2 is stored in different reservoirs would help high school students better grasp the concept. At the beginning of their presentation, the grad students asked the audience to hold their breath for five seconds. IF the five seconds represented the average length of time that CO2 spends in the atmospheric reservoir (tens of years), THEN they'd have to hold their breath for 6.5 years to represent the average amount of time CO2 is stored in earth's sediments/soils (hundreds of thousands to millions of years). We reworded the focus question ("How is C02 Removed from the Atmosphere and Stored for a Long time in Soils and Sediments?") and also reshaped the concept map into a pyramid to illustrate the small amount of time carbon dioxide spends in the atmosphere (top) versus in the sediments (bottom). The students decided to use some familiar "props" in their presentation: pine tree branches and seaweed as examples of terrestrial and marine primary producers that absorb and transform atmospheric CO2. They also showed calcium carbonate shells to represent the second major pathway described in the concept map. The team also felt it was important to talk about the "return loop": how buried CO2 can be returned to the atmosphere by nature (e.g., volcanoes) or human industrial processes (e.g., extraction / burning of fossil fuels).
View All Concept Maps Created at this Workshop
Concept map