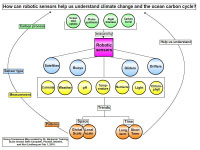
Scientist Benjamin Twining explains the concept map and its development:
I chose a focus question that allowed me to 'cast my net wide' to address a very broad topic in my field of oceanography:
"How can sensor technology help us understand the ocean carbon cycle?"
In my first concept map, I really tried to focus on the sensors because not many people in the general public may understand what they are or how
they are used by scientists. Sensors can refer to instruments collecting environmental data (aka "sensing the environment") which are installed
on a variety of 'sampling platforms' such as satellites, buoys, drifters, autonomous underwater vehicles. I felt it was important to include
examples of the wide variety of information that sensors can provide to scientists and over which scales that data is relevant. For example,
I added a box for "global scale" because satellites allow us to monitor many variables (e.g., temperature, salinity, light) - depending on their
sensor 'payloads' - over incredibly large areas on Earth. These satellites and their sensors help researchers (who can't be everywhere directly
sampling the oceans all the time) to 'remotely sense' how the ocean differs over time and space on many different scales (e.g., local, regional
or global). Sensors can even measure phytoplankton distributions throughout the ocean (both horizontally and vertically), crucial nutrient
concentrations for phytoplankton growth, and seawater pH (degree of acidity)- which gives us insight into key parts of the oceanic carbon cycle.
The green boxes on my map list what data from these sensors can tell us: carbon cycling rates, as well as quantity, types, and rate of phytoplankton
growth and photosynthesis. One of the important roles the ocean can play in the carbon cycle is that it has the ability to absorb (from the atmosphere)
and store a certain amount of carbon. By analyzing all these data streams from sensors distributed around the world, we can improve our
understanding of how the ocean has a dynamic role in this process.
On the second day of the workshop, my team decided to edit some of the terminology used (for example: removing "autonomous" from the description of
the sensors because this could be confusing). They suggested significantly re-arranging the map. My 'left-to-right' map became a 'top-to-bottom'
map, and became more hierarchical in nature. We collectively decided to include more examples of types of sensors and the data they collect, but
also include 'the stories' about the ocean conditions that they are telling us. The team also added more connecting lines from the sensors back
to the "big picture" of our overall understanding of the carbon cycle. By looking at the patterns of data that remote sensors can measure over
long term and sort term levels, and on small and large scales, we can help better understand the components of the global carbon cycle.
When the students in my group attempted to present the revised map to high school students, they were struck with the unfortunate luck of having
the power go out. Being resourceful and creative people, they managed to present the concept map content -sans computer- with a few cleverly
improvised visual aids. A banana served to illustrate the function of a glider, and a large pepper mill became a drifter. Though the last-minute
switch of presentation format was daunting, they did a great job presenting this complex topic to the high school audience. The students also
emphasized to the audience that they, too, could become researchers and discover more about the ways in which the ocean and climate interact.
Our world needs more curious scientists to tease apart this grand puzzle!
|
 on the first day<br />of the graduate student / faculty collaborative workshop','Concept map'))
)
)